
The customer service KPIs telecom operators should track, each with a formula, a current industry benchmark, and the lever that moves it. Updated with 2026 ACSI and contact center data.
Quick answer: The telecom customer service KPIs that predict churn are First Contact Resolution, Customer Effort Score, and Repeat Contact Rate. Queue metrics such as Average Speed of Answer and Abandonment Rate show problems earlier. Loyalty metrics such as CSAT, NPS, and churn report the outcome. Telecom-specific measures including Truck Roll Avoidance and Self-Service Containment are where operators find margin that generic KPI lists miss.
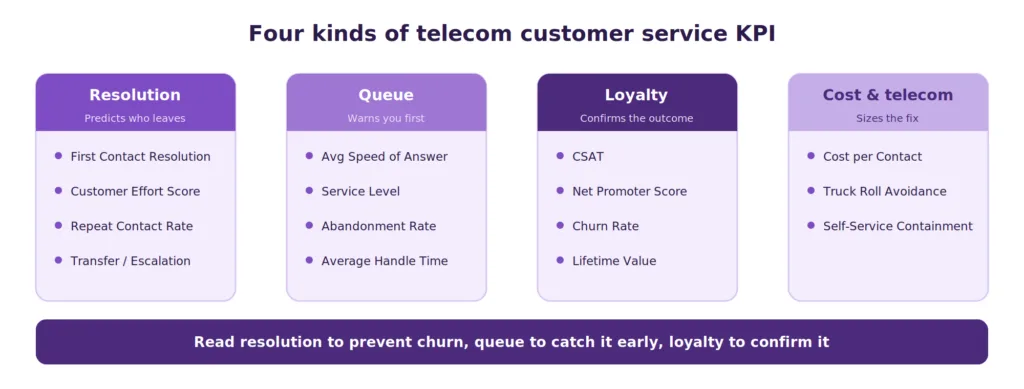
Diagram of the four categories of telecom customer service KPIs and what each one answers
Why These Metrics Decide Who Churns
Telecom sits in an unusual position. Switching costs are low, contracts are shorter than they used to be, and number portability means a frustrated subscriber can leave within an afternoon. Support quality is one of the few defenses an operator still fully controls.
The satisfaction picture has improved, which makes the competitive bar higher rather than lower. The 2026 ACSI Telecommunications study found wireless service providers reaching a record ACSI score of 77, with internet service providers up 1% to 73. When the sector average rises, matching last year’s performance means falling behind.
Two figures explain why support is the lever rather than pricing. PwC’s 2025 Customer Experience Survey found that 52% of consumers abandon a brand after a bad experience, with close to a third leaving over poor service specifically. The same research found executives believe loyalty has grown while customers disagree, and that perception gap is where unmeasured churn accumulates.
The economics compound it. Winning a replacement subscriber costs several times more than retaining an existing one, so an avoidable disconnect charges you twice: once in lost revenue and once in acquisition spend.
All 15 KPIs With 2026 Benchmarks
Benchmarks below reflect published contact center and telecom industry data as of August 2026. Treat them as reference ranges rather than targets, since a fair target depends on your issue mix.
| KPI | Formula | 2026 benchmark | Category |
|---|---|---|---|
| First Contact Resolution | Issues resolved first contact / total issues | 70 to 79%, best-in-class 90% | Resolution |
| Customer Effort Score | Average of effort ratings | Lower is better, track trend | Resolution |
| Repeat Contact Rate | Repeat contacts / total contacts | Under 15% | Resolution |
| Transfer and Escalation Rate | Transferred contacts / total contacts | Under 10% | Resolution |
| Average Speed of Answer | Total wait time/calls answered | Under 28 seconds | Queue |
| Service Level | Calls answered in target / total calls | 80% within 20 seconds | Queue |
| Abandonment Rate | Abandoned calls/total offered | 2 to 5%, investigate above 8% | Queue |
| Average Handle Time | Talk plus hold plus wrap / contacts | 4 to 7 minutes | Queue |
| CSAT | Satisfied responses / total responses | 85% or higher | Loyalty |
| Net Promoter Score | Promoters % minus detractors % | Sector average near 24 | Loyalty |
| Customer Churn Rate | Customers lost/starting customers | Sector runs high, track monthly | Loyalty |
| Customer Lifetime Value | ARPU x average tenure x margin | Rising trend | Loyalty |
| Cost per Contact | Total operating cost/contacts | Falls with deflection | Cost |
| Truck Roll Avoidance Rate | Remote fixes/issues needing a fix | Higher is better | Telecom-specific |
| Self-Service Containment | Contained sessions / total sessions | Track with escape rate | Telecom-specific |
The grouping matters more than the individual numbers. Resolution metrics tell you why a subscriber will leave. Queue metrics warn you before satisfaction drops. Loyalty metrics confirm what already happened. Cost metrics tell you what it is worth fixing.
Resolution and Effort KPIs
These four predict churn more reliably than anything else on the list, because they measure whether the subscriber ended the interaction feeling fixed and calm.
1. First Contact Resolution
Formula: issues resolved on the first contact divided by total issues, expressed as a percentage.
FCR is the single most useful number a telecom support floor produces. Published contact center benchmarks put the industry range at 70 to 79%, with world-class operations reaching 90%. Telecom operators should segment it, because billing questions and technical faults resolve at very different rates, and a blended figure hides both.
What moves it: giving agents unified access to billing, CRM, and network status in one place so they stop transferring; grounding agents in a maintained knowledge base rather than tribal memory; and tracking repeat calls by issue type to find the recurring faults training has not covered. There is more detail in this guide to first call resolution.
The trap: agents can inflate FCR by closing tickets that will reopen tomorrow. Always read it alongside Repeat Contact Rate.
2. Customer Effort Score
Formula: average response to a single question asking how much effort the customer had to expend.
Effort predicts loyalty better than satisfaction. Gartner’s research found that 96% of customers who had a high-effort experience became disloyal, compared with 9% of those with a low-effort experience. In telecom, effort accumulates through channel switching, repeated identity checks, and being asked to explain an outage three times.
What moves it: removing repeated authentication, keeping full context on one record so nobody re-explains, and cutting transfers.
3. Repeat Contact Rate
Formula: contacts about a previously raised issue divided by total contacts.
This is FCR’s honesty check. A rate above roughly 15% usually means resolutions are being recorded rather than achieved. Segment it by billing, technical fault, and outage, because those categories fail differently.
4. Transfer and Escalation Rate
Formula: contacts transferred or escalated divided by total contacts.
Every transfer forces the subscriber to repeat themselves, which is among the strongest drivers of effort. In telecom, escalations concentrate around disputed charges and technical faults, so those two categories are where tier-one enablement pays back fastest.
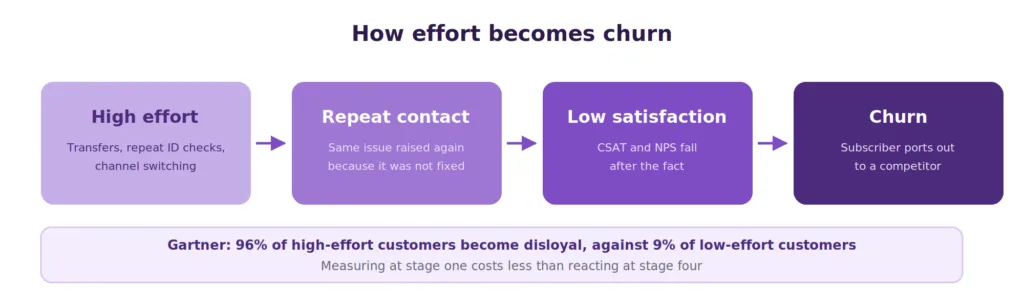
Diagram showing how customer effort leads to repeat contacts and then to churn
Queue and Access KPIs
These govern what happens before an agent speaks. They deteriorate first, which makes them the earliest warning available.
5. Average Speed of Answer
Formula: total wait time divided by calls answered.
Long waits damage satisfaction before the conversation starts. Telecom makes this harder than most sectors because outages create volume spikes with no notice, so a staffing model built on daily averages fails exactly when it matters.
What moves it: flexible staffing tied to network incident alerts, and proactive outage notification that stops the call from being placed at all.
6. Service Level
Formula: calls answered within the target window divided by total calls.
The long-standing standard is to answer 80% of calls within 20 seconds. Track it hourly rather than daily, because outage traffic disappears inside a daily average and reappears as a churn number a quarter later.
7. Abandonment Rate
Formula: calls abandoned before answer divided by total calls offered.
A healthy range sits between 2 and 5%. Anything sustained above 8% usually indicates a staffing or routing problem rather than customer impatience. Abandonment moves before CSAT does, which makes it a leading indicator worth watching daily.
8. Average Handle Time
Formula: talk time plus hold time plus after-call work, divided by contacts handled.
General service inquiries run roughly 4 to 7 minutes, though telecom technical calls legitimately run longer.
AHT is the most frequently misused metric in this list. Pushing it down as a target damages FCR, because a rushed agent creates tomorrow’s callback. Read it as a diagnostic that explains staffing cost, and let resolution govern the target. The same logic applies to average handle time generally.
Loyalty and Satisfaction KPIs
These reach the board. They confirm outcomes rather than predict them, which is why they should never be the only numbers on a dashboard.
9. Customer Satisfaction Score
Formula: satisfied responses divided by total responses, as a percentage.
A common target is 85% or above. Survey immediately after the interaction, and segment by channel and issue type, since a blended CSAT hides the billing problem underneath a healthy technical score.
CSAT alone is a weak churn predictor. Satisfied subscribers still leave for a better offer, and irritated ones sometimes stay because switching feels like effort. Pair it with CES and FCR.
10. Net Promoter Score
Formula: percentage of promoters scoring 9 to 10, minus percentage of detractors scoring 0 to 6.
Telecom carries one of the lowest average NPS figures of any major sector, near 24. That reflects structural frustration with the category rather than any single operator’s failings, so compare against telecom peers rather than against cross-industry averages.
Tie detractor follow-up to revenue at risk. A detractor on a high-value business line is a different problem from a detractor on a prepaid consumer plan.
11. Customer Churn Rate
Formula: subscribers lost during a period divided by subscribers at the start of that period.
Churn is the outcome every other metric feeds. Track it monthly, split voluntary from involuntary, and segment by tenure, because early-life churn usually points to onboarding while late-life churn points to pricing or competitor offers.
12. Customer Lifetime Value
Formula: average revenue per user multiplied by average tenure, multiplied by gross margin.
CLV is what converts a support improvement into a finance conversation. Cutting churn by a single point compounds through the whole subscriber base, which is why retention investment usually outperforms acquisition spend at equivalent cost.
Cost and Telecom-Specific KPIs
The last group ties service to margin. Two of these appear on almost no generic KPI list and are where telecom operators find their most defensible savings.
13. Cost per Contact
Formula: total support operating cost divided by total contacts handled.
Lower it by removing repeat contacts and transfers rather than by shortening conversations. Reducing contacts is durable; rushing them is not, since a rushed contact returns as a second contact.
14. Truck Roll Avoidance Rate
Formula: issues resolved remotely divided by total issues that required a fix.
A truck roll dispatches a technician to a customer site, and each one carries substantial cost plus a scheduling window the subscriber resents. Every fault diagnosed and fixed over the phone or in-app protects margin and resolves faster.
What moves it: remote diagnostics available to tier-one agents, guided troubleshooting flows in the app, and clear escalation criteria so genuine hardware failures are dispatched immediately rather than after three failed calls. This is the KPI most likely to be missing from an existing telecom dashboard and most likely to be worth adding.
15. Self-Service Containment Rate
Formula: sessions resolved without an agent divided by total self-service sessions.
Containment measures issues handled by IVR, app flows, help articles, or an AI agent. Measure it alongside escape rate, since a high containment number can mean customers were genuinely helped or that they gave up. A trapped subscriber is worse than one who reached an agent immediately.
SIM activation, plan changes, balance queries, and password resets are the telecom categories that contain well. Outage status and disputed billing generally do not, and routing those to a human quickly protects both effort and satisfaction.
How to Build a Telecom KPI Dashboard
Fifteen metrics on one screen produces paralysis. Layer them instead.
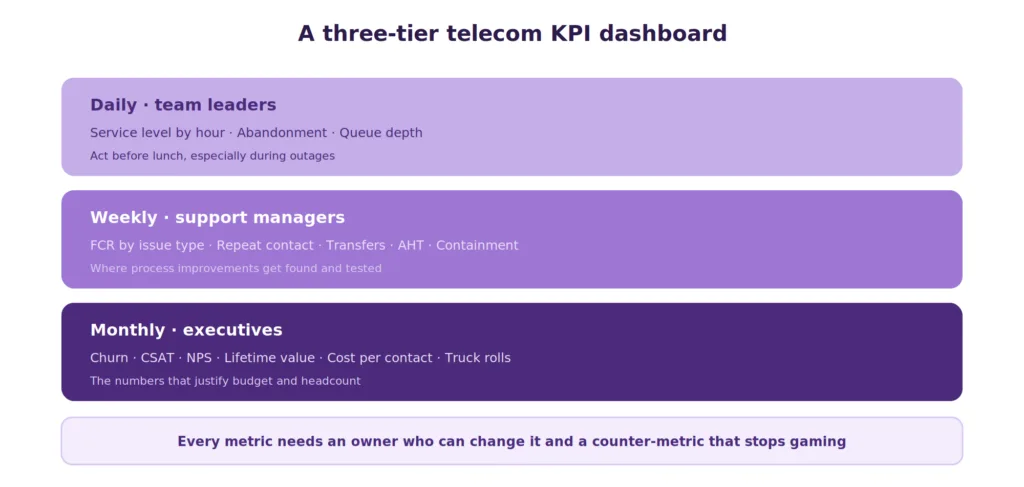
Diagram of a three-tier telecom KPI dashboard from daily operations to board reporting
Daily, for team leaders. Service level by hour, abandonment rate, and queue depth. These are the numbers you act on before lunch, and they matter most during network incidents when averages stop being meaningful.
Weekly, for support managers. FCR by issue type, repeat contact rate, transfer rate, AHT, and containment. This is the layer where process improvements get identified and tested.
Monthly and quarterly, for executives. Churn, CSAT, NPS, CLV, cost per contact, and truck roll avoidance. These are the numbers that justify budget and headcount.
Two rules keep the dashboard honest. Every metric needs a named owner who can actually change it, and every metric needs a paired counter-metric so nobody optimizes one at the expense of another. AHT pairs with FCR. Containment pairs with escape rate. Cost per contact pairs with CSAT.
Five Mistakes That Make KPIs Useless
Reading averages during outages. Telecom volume is spiky by nature. A daily average smooths away the four hours when your service level collapsed, and your subscribers decided to switch.
Setting AHT as a target. It is the most common self-inflicted wound in contact center management. Agents hit the number by closing early, FCR falls, repeat contacts rise, and total cost increases.
Blending issue types. A single FCR figure across billing, technical, and outage calls is close to meaningless, since each resolves differently. Segment everything.
Measuring deflection rather than resolution. Deflection counts contacts avoided. Resolution counts problems solved. A customer who abandons a chatbot in frustration registers as deflected and returns tomorrow angrier.
Tracking without a counter-metric. Any single metric can be gamed. Paired metrics cannot be gamed as easily, because improving one at the other’s expense shows up immediately.
Where AI Changes These Numbers
AI moves three KPIs in this list directly, and its performance depends on something most operators underinvest in.
Containment and FCR both rise when an AI agent answers from accurate content rather than a scripted decision tree. Cost per contact falls as a consequence rather than as a target. Truck roll avoidance improves when guided diagnostics reach the subscriber before a technician is booked.
The dependency is documentation quality. Gartner’s 2025 AI Implementation Survey found that 62% of underperforming AI customer service projects trace to data preparation rather than model limitations. For telecom, that means tariff details, device guides, and outage procedures being current, because an AI quoting a retired plan creates a billing dispute rather than resolving one.
This is where Kayako fits. Agent Kay resolves routine telecom questions such as SIM activation, plan changes, and balance queries directly from your knowledge base; SingleView keeps full subscriber history on one record, so answers carry context and effort stays low; and billing is per resolved ticket rather than per seat, so improving containment reduces cost instead of leaving it flat.
Trilogy provides the clearest illustration. After moving to Kayako, the team removed 80% of ticket volume, reached 76% autonomous resolution, and cut ticket age from 17.6 hours to under two minutes during a 90-day rollout.
The metrics that matter in telecom are the ones that explain a disconnection before it happens. First Contact Resolution, Customer Effort Score, and Repeat Contact Rate do that work. Queue metrics warn you earlier still. Loyalty metrics confirm the result, and cost metrics tell you what the fix is worth.
The 2026 ACSI data raises the stakes, because a sector improving on satisfaction means standing still is losing ground. Two additions will do more for most operators than refining what they already track: adding Truck Roll Avoidance to the dashboard, since it is usually missing and usually significant, and pairing every existing metric with a counter-metric so nobody hits a number by damaging another one.
Start by segmenting FCR by issue type this month. That single change tends to reveal more about where subscribers are leaving than any new metric you could add.
Frequently Asked Questions
What are the most important customer service KPIs for telecom companies?
First Contact Resolution, Customer Effort Score, and Repeat Contact Rate predict churn most reliably. Churn, CSAT, and NPS report the outcome. Truck Roll Avoidance and Self-Service Containment are the telecom-specific measures generic KPI lists usually omit.
What is a good first call resolution rate for telecom?
Published contact center benchmarks put the industry range at 70 to 79%, with world-class operations reaching 90%. Telecom operators should segment by issue type, since billing and technical faults resolve at very different rates.
What is the average customer satisfaction score in telecom?
The 2026 ACSI study puts wireless service providers at a record 77 and internet service providers at 73 on the 0 to 100 ACSI scale. For post-interaction CSAT surveys, a common operational target is 85% or above.
Why is telecom NPS so low?
Telecom carries one of the lowest average NPS figures of any major sector, near 24, which reflects category-wide frustration with billing complexity, contract terms, and service reliability rather than any single operator. Compare against telecom peers rather than cross-industry averages.
What is a healthy call abandonment rate?
Between 2 and 5% is generally healthy. Sustained readings above 8% usually indicate staffing or routing problems. Watch it during billing cycles and network incidents, when it spikes first.
How do I reduce average handle time without hurting resolution?
Remove work rather than rushing conversations. Unified access to billing, CRM, and network status cuts hold time, automated after-call summaries cut wrap time, and self-service on routine queries removes short contacts from the mix entirely. Never set AHT as a standalone target.
What is truck roll avoidance rate?
The share of faults resolved remotely rather than by dispatching a technician. Each avoided visit saves substantial cost and resolves faster. Remote diagnostics and guided in-app troubleshooting are the main levers.
How often should telecom KPIs be reviewed?
Queue metrics such as service level and abandonment need daily review and hourly review during incidents. Resolution metrics suit a weekly cadence. Loyalty and cost metrics belong in monthly and quarterly reporting.
What is the difference between deflection and containment?
Deflection counts contacts that never reached an agent, including customers who gave up. Containment counts self-service sessions that genuinely resolved the issue. Measure containment alongside escape rate to tell the two apart.
Which KPI best predicts customer loyalty in telecom?
Customer Effort Score. Gartner found 96% of customers with a high-effort experience became disloyal, against 9% of those with a low-effort experience, which makes reducing effort the most direct route to protecting revenue.