Learn what average handle time (AHT) is, how to calculate it, what industry benchmarks look like in 2025, and proven ways to reduce AHT without hurting quality or CSAT.
A patient calls at 8:07 a.m. for what sounds like a simple appointment request. By 8:11, the agent has checked availability, verified insurance, placed the caller on hold, consulted another department, and is now documenting notes in a second system. One call. A chain of small tasks, decisions, and handoffs. Sound familiar?
That’s exactly why average handle time or AHT matters so much. It doesn’t just clock how long someone was on the phone. It captures the full operational weight of every customer interaction: talk time, hold time, and the wrap-up work that happens after the customer hangs up.
AHT is one of the clearest windows into whether your team is efficient, whether your tools are helping or slowing things down, and whether customers are getting the resolution they actually need. In contact centers, healthcare environments, and enterprise support teams, average handle time can point to training gaps, workflow friction, and hidden cost drivers.
In this guide, we break down what AHT is, why it matters, how to calculate it, what the average handle time industry standard looks like in 2025, how to reduce it without killing quality — and how Kayako’s AI platform helps support teams get there faster.
What Is Average Handle Time (AHT)?
At its core, what is average handle time? It’s the average amount of time an agent spends on a customer interaction — from the first word to the final note in the CRM. That includes three components:
- Talk time: The live conversation with the customer.
- Hold time: Time the customer spends waiting while the agent checks something.
- After-call work (ACW): Documentation, system updates, follow-up tasks — the invisible labor after every call.
So the short definition: AHT is a productivity metric and a complexity metric at the same time. A high AHT might mean your agents are slow — or it might mean your customers’ issues are genuinely hard. Context is everything.
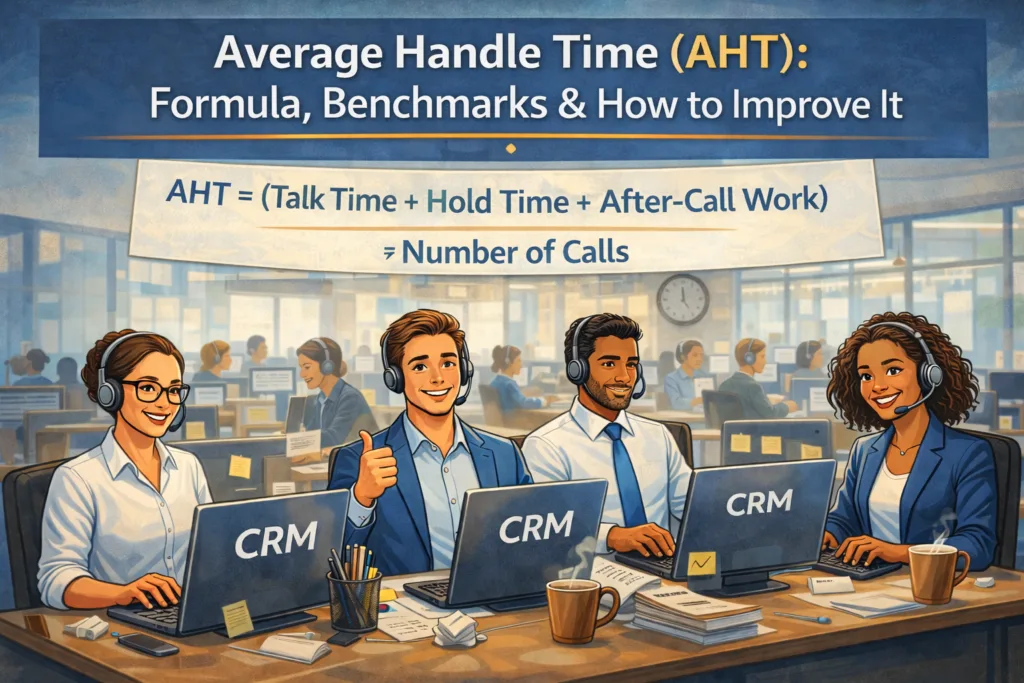
The Basic AHT Formula
| Average Handle Time Formula
AHT = (Talk Time + Hold Time + After-Call Work) ÷ Number of Calls |
The average handle time formula is straightforward. The interpretation is where things get interesting. You can calculate AHT per agent, per team, per call type, or across a whole period. And in most modern contact centers, AHT applies to voice, chat, email, and any channel where a resolution requires agent effort.
What AHT Actually Tells You
Break it down by component and you get real diagnostic power:
- High talk time? Issue complexity. Agents may not have the information they need quickly enough.
- High hold time? Workflow bottlenecks or access friction — agents searching for answers instead of having them.
- High ACW? Documentation burden, disconnected tools, or no automation on routine fields.
AHT doesn’t just measure speed. It maps the operational shape of the work itself.
Why Average Handle Time Matters (More Than You Might Think)
Picture two teams handling the same call volume on a Monday morning. One resolves issues efficiently, documents clearly, keeps customers informed. The other spends the same amount of time “working” — with long holds, repeated explanations, and a pile of unfinished wrap-up at end of shift. Both teams are busy. Only one is running well.

AHT Has a Direct Impact on Cost
Every extra minute spent handling a contact increases labor cost per call. According to SQM Group’s 2025 benchmarks, the average handle time industry standard for customer service call centers is around 10 minutes — though real-world figures cluster closer to 6–8 minutes depending on call type. When AHT climbs without a corresponding improvement in resolution quality, you need more agents to handle the same volume. That’s a compounding cost problem.
AHT Affects Service Levels and Queue Experience
When interactions take longer, fewer agents are available for the next person in queue. That ripples into longer wait times, higher abandonment rates, and a worse experience for everyone waiting. AHT isn’t just an agent-level metric — it shapes the entire customer experience, from first ring to resolution.
AHT Is a Complexity Signal, Not Just a Speed Signal
A higher AHT isn’t automatically a problem. Sometimes it simply means your team is handling harder work — more consultative conversations, more complex escalations, more compliance-sensitive calls. A 2025 CallMiner analysis positions extended AHT signals as “diagnostic indicators of process or experience gaps, rather than justification for tightening agent quotas.” That’s an important distinction.
AHT Only Makes Sense Alongside Quality Metrics
A lower AHT is not a win if it comes with lower first call resolution, weaker CSAT scores, or more repeat contacts. Always pair AHT with FCR, CSAT, NPS, and cost per call. The best teams don’t treat AHT like a race. They treat it like one signal in a larger operational system.
Is your team’s AHT hiding bigger problems?
See how Kayako’s AI surfaces the real story behind your support metrics.
How to Calculate Average Handle Time
The math is easy. The interpretation is where people get tripped up.
| AHT = (Total Talk Time + Total Hold Time + Total After-Call Work) ÷ Number of Calls Handled
Example: (800 + 150 + 50) ÷ 40 = 25 minutes per call |
Let’s break that example down:
- Total talk time: 800 minutes
- Total hold time: 150 minutes
- Total after-call work: 50 minutes
- Total calls handled: 40
- Result: AHT = 25 minutes per call
Where Teams Get It Wrong
The most common mistakes with the average handle time formula:
- Inconsistent definitions: Some ACDs include hold time within talk time. Others track them separately. Neither is wrong — but you must be consistent. If the definition shifts between reports, your trend line means nothing.
- Denominator confusion: Does “calls handled” include transferred calls? Abandoned calls? The answer changes your number — and your conclusions.
- Isolating AHT from quality: If AHT falls while repeat contacts rise, you haven’t improved anything. You’ve just moved the problem.
The moment you see AHT fall and FCR improve at the same time — that’s the signal you’re actually making progress.
Average Handle Time Industry Standards and Benchmarks (2025)
Here’s the honest answer about what average handle time industry standards actually look like: it depends. Industry, channel, call type, and team structure all push the number in different directions. But you still need a reference point to know if you’re operating normally or if something is quietly broken.
Sprinklr’s 2026 contact center data pegs the overall industry average call center average handle time at 6 minutes and 10 seconds. SQM Group’s benchmark research puts it closer to 10 minutes when measuring across a broader cross-section. The gap? Different sample populations, different call types. Both numbers are useful context — neither should be treated as a hard target.
A 2026 analysis by Bland.ai found that AHT can vary by up to 20% based on issue complexity alone, reinforcing that flat benchmarks are almost never useful without segmenting by call type. Here’s a more granular breakdown by industry:
| Industry | Avg AHT | FCR Benchmark | Key Driver |
| General Customer Service | 6 min 10 sec | 70–79% | Routine query volume |
| SaaS / Tech Support | 7–10 min | 72–80% | Technical complexity |
| Healthcare Call Centers | 3–6 min | 75–82% | Scheduling & triage |
| Banking & Financial Services | 4–7 min | 70–78% | Compliance & verification |
| Telecom | 8–12 min | 65–75% | Technical troubleshooting |
| Retail & eCommerce | 3–5 min | 75–85% | Order & returns queries |
P.S- For a detailed guide on average handle time industry standards, click here.
What “Good” AHT Actually Looks Like
A good AHT is relative, not absolute. The healthiest definition:
- Are issues being resolved on the first contact?
- Is the customer experience positive?
- Are agents getting enough time to work accurately — or are they cutting corners?
- Is the team meeting service level targets without burning out?
If AHT is artificially low because agents are rushing verification or skipping required documentation, the metric is hiding risk. If AHT is high because systems are slow or knowledge is hard to find, the metric is pointing to inefficiency. The difference matters enormously for how you respond.
Also worth noting: according to Kayako’s own analysis on why average handle time is a misleading metric, treating AHT as a primary success metric can actively harm customer experience. The best-performing teams use it as a diagnostic lens — not a leaderboard.
Struggling to hit the right AHT without hurting quality?
Kayako’s AI support platform helps teams resolve faster and smarter.
How to Reduce Average Handle Time (Without Hurting Quality)
A clinic manager sees the same pattern every Monday: longer calls, more documentation delays, agents jumping between three systems to close one interaction. The easy answer: tell people to “move faster.” The better answer: redesign the work.
Contact centers using AI are already seeing results. In early 2025, AI tools helped reduce AHT by nearly 25% by automating routine steps and surfacing answers in real time during calls. And according to McKinsey, 63% of service leaders say AI tools have already reduced average handle times across their operations.
Here are the highest-leverage ways to improve average handle time without compromising resolution quality:
P.S. Check out this blog for a detailed guide on how to improve average handle time
1. Audit the End-to-End Call Journey
Map every step from the first answer to the final wrap-up note. You’re looking for unnecessary holds, redundant verification steps, and duplicate documentation. You almost always find at least one of them.
2. Standardize Documentation Templates
Unstructured after-call work is one of the biggest hidden AHT drivers. Templates that auto-populate known fields and prompt agents for required information can shave minutes off every interaction without changing what agents say.
3. Invest in Continuous Agent Training
Ongoing coaching improves product knowledge, call control, and system fluency — all of which reduce both talk time and hold time. Kayako’s agent productivity resources go deeper on this.
4. Build a Fast, Accurate Knowledge Base
Agents who can’t find answers quickly put customers on hold. A well-structured internal knowledge base is one of the most direct ways to reduce average handle time — because hold time drops when agents don’t have to search.
5. Optimize Call Routing
Send customers to the right queue first time, every time. Poor routing generates transfers, transfers generate handle time, and handle time generates cost. Smart routing is one of the highest-ROI interventions in a contact center. See Kayako’s piece on omnichannel contact centers for a deeper look.
6. Use Automation on Routine ACW
Auto-populated customer data, automated ticket tagging, and AI-generated call summaries can cut after-call work dramatically. According to IBM’s 2026 contact center automation analysis, one bank that introduced an AI-driven assistant achieved a 6% reduction in average handle times along with lower training requirements — without scripting a single new call flow.
7. Simplify IVR and Phone Trees
If callers spend two minutes navigating menus before reaching an agent, that’s wasted time baked into your AHT before the conversation even starts. Audit your IVR flow the same way you’d audit your call scripts.
8. Educate Customers Proactively
Clear pre-visit instructions, well-designed FAQ pages, and proactive outreach can prevent calls that would otherwise be repetitive and long. Fewer low-value calls = more capacity for the complex ones that actually need a human.
One more stat worth holding: McKinsey’s 2025 contact center analysis found that AI-enabled contact centers have halved cost per call while improving customer satisfaction scores. Speed and quality aren’t in opposition — they’re a package deal when you fix the right things.
Ready to cut AHT without cutting corners?
See how Kayako’s AI resolves tickets faster — with full context, every time.
Average Handle Time Industry Standards by Channel and Vertical
The call center average handle time benchmark you’ve probably seen quoted — around 6 minutes — is a blend of everything. Voice calls, chat sessions, email threads, technical support, retail order queries. Blend them all and you get 6 minutes. Break them out and the picture looks very different.
Xima Software’s 2025 analysis notes that contact centers using AI see a 9% reduction in average handling time, with top performers pushing further — particularly when AI handles routine ACW and surfaces real-time answers during live calls.
By Channel
- Voice: 6–10 minutes is typical. Longest because of hold time and real-time constraints.
- Live chat: Shorter — 4–6 minutes — but agents often handle multiple concurrent chats, so raw AHT understates the real workload.
- Email: Harder to measure against the same formula, but ticket-to-resolution time typically runs 12–24 hours for first response, with true resolution measured differently.
By Team Size and Complexity
Smaller, specialized teams handling complex B2B issues will consistently run longer AHTs than large-volume teams handling simple consumer queries. This is expected — and healthy. The error is applying the same benchmark across both.
If you’re forecasting how to staff your support team or evaluating whether your operation is performing at benchmark, segmenting by call type is the only way to get a number that means something.
How to Forecast Average Handle Time
Knowing your current AHT is useful. Being able to forecast average handle time accurately is what drives workforce planning, budget decisions, and capacity management.
The Basic Forecasting Approach
Start with historical AHT data segmented by:
- Call type (scheduling, billing, escalation, routine query)
- Channel (voice, chat, email)
- Time of day and day of week
- Agent experience level
Apply projected call volume against each segment to estimate total handle time required, then map that against available agent hours. That’s your staffing model.
Where Forecasts Break Down
Most forecasting models assume AHT is stable. It’s not. Factors that shift AHT unpredictably:
- New product launches (more complex queries, agents learning on the fly)
- System outages (call volume spikes, AHT spikes)
- Seasonal demand shifts (longer hold times, more transfers)
- New agent cohorts onboarding (AHT rises temporarily before training lands)
Build in a variance buffer. And use your contact center automation and AI tools to monitor real-time AHT deviation — not just report it after the shift ends.
Average Handle Time Calculator: Run the Numbers
No tool required. Use this simple average handle time calculator approach on your next report:
| Your AHT Calculator
AHT = (Total Talk Time + Total Hold Time + Total After-Call Work) ÷ Total Calls Handled |
Step 1: Pull your total talk time, hold time, and ACW from your ACD or CRM for the period you’re measuring.
Step 2: Add all three. This is your Total Handle Time.
Step 3: Divide by the total number of calls handled (not offered — handled).
Step 4: Segment by call type. A single blended AHT number is almost always misleading on its own.
Step 5: Compare against your previous period and against the industry benchmarks in the table above.
If your AHT is significantly higher than benchmark, look at hold time first — it’s usually the biggest single lever. If ACW is the culprit, automation and templates fix it faster than coaching alone.
How Kayako Helps You Hit the Right AHT
Most platforms tell you what your AHT is. Kayako helps you actually do something about it. Here’s where the Kayako AI-powered customer support platform directly addresses the root causes of high AHT:
Instant Context — No More “Let Me Pull Up Your Account”
Kayako surfaces full customer history, ticket context, and conversation threads the moment an interaction starts. Agents don’t spend the first 90 seconds of every call searching. That alone can meaningfully reduce talk time on routine contacts. See how it works in Kayako’s overview of AI-powered customer support.
AI-Suggested Responses and Knowledge Surface
Kayako’s AI recommends answers in real time during live interactions — pulling from your knowledge base, past tickets, and documented resolutions. Agents stop putting customers on hold to find answers. Hold time drops. Handle time drops. CSAT goes up.
Automated After-Call Work
Kayako automates ticket tagging, status updates, and call summaries after interactions close. That’s ACW cut without asking agents to work faster — the system does the routine work, and agents focus on the next customer. Check out more on helpdesk automation with Kayako.
Omnichannel Without the Context Switching
Whether the customer came in via email, live chat, or phone, Kayako maintains a single conversation thread. No more agents asking customers to “start over” because the previous channel’s history isn’t visible. That removes a significant driver of inflated handle time — and repeat contacts. Explore Kayako’s omnichannel contact center approach for more detail.
Real-Time Reporting That Actually Means Something
Kayako’s dashboards track AHT alongside FCR, CSAT, time to resolution, and ticket volume — so you’re never optimizing AHT in isolation. You’re optimizing the full picture.
See what Kayako can do for your AHT
Talk to a support strategy expert and get a plan built for your team.
Average Handle Time: Frequently Asked Questions
What does average handle time include?
Average handle time includes talk time, hold time, and after-call work (ACW). In omnichannel environments, it may also include chat time, after-chat work, and time spent on email or asynchronous resolution. The key is consistency: whichever components you include, use the same definition across every report.
What is a good average handle time?
There’s no single answer — it varies by industry, channel, and call type. For general customer service, Sprinklr’s 2025 data puts the benchmark at around 6 minutes and 10 seconds. For healthcare, expect 3–6 minutes for routine calls and longer for complex cases. For tech support, 7–10 minutes is common. A “good” AHT is one that supports quality service and is improving over time alongside FCR and CSAT — not one that’s simply the lowest possible.
Is a lower AHT always better?
No. Lower is only better if resolution quality holds or improves. A team that rushes calls can produce low AHT alongside low FCR, high repeat contact rates, and poor CSAT. The risk is real: Kayako’s analysis of why AHT can be a misleading metric covers this in detail. Always evaluate AHT in the context of resolution quality.
How do I reduce average handle time without hurting quality?
The highest-leverage levers: build a fast knowledge base so agents don’t hold to search; standardize documentation templates to cut ACW; optimize call routing so customers reach the right agent first time; and use AI-assist tools to surface answers in real time. For a full breakdown, see the Ways to Improve Average Handle Time section above.
What’s the difference between AHT and MTTR?
AHT measures the labor time spent handling a specific contact interaction. Mean Time to Resolve (MTTR) measures elapsed time from the start of an incident to final ticket closure — which can be days or weeks if escalations are involved. AHT is an interaction metric. MTTR is a resolution lifecycle metric. Both matter; they measure different things.
How do I forecast average handle time?
Segment historical AHT by call type, channel, time of day, and agent experience level. Apply projected call volumes to each segment to estimate total handle time required. Add a variance buffer — new products, outages, and seasonal shifts will all move AHT unpredictably. Revisit your forecast monthly against actuals.
How does AI affect average handle time?
According to a 2025 analysis by Sycurio, AI tools already help reduce AHT by nearly 25% by automating routine steps and surfacing real-time answers during calls. And McKinsey’s 2025 contact center research found that Gen AI-enabled agents achieve a 14% increase in issues resolved per hour alongside a 9% reduction in handle time. AI doesn’t just accelerate agents — it removes the friction that was slowing them down.
The Bottom Line on Average Handle Time
Average handle time is one of the most useful contact center metrics precisely because it reveals how much effort is required to serve each customer interaction. But the real value only appears when you interpret it properly.
Don’t optimize AHT in isolation. Improve the process around it. Remove friction with better routing, clearer documentation, smarter dashboards, and AI tools that actually surface answers when agents need them. Track AHT alongside FCR, CSAT, NPS, time to resolution, and cost per call — so you can tell the difference between genuine efficiency and speed that’s hiding problems.
The teams that get this right don’t treat AHT as a pressure point. They treat it as a diagnostic tool. Faster where it should be faster. Thorough where it needs to be thorough. And always aligned with a better customer experience.
If you want to see what that looks like in practice — with real-time AI assist, automated ACW, and omnichannel context that actually follows the customer — Kayako’s strategy session is a good place to start.
Your AHT problem is solvable. Let’s map out how.
Book a free strategy session with Kayako’s support team today.