Learn what Time to Resolution (TTR) is, why it matters, and how to optimize it with data-backed tactics that drive faster support and better user experiences.
Time to Resolution (TTR) plays a pivotal role in ensuring customer satisfaction and operational efficiency.
In this comprehensive guide, we’ll dive deep into the nuances of Time to Resolution-what it is, why it matters, how to accurately calculate it, and strategic methodologies to improve it. We also explore related metrics like MTTR (Mean Time to Resolution), industry benchmarks, and leverage advanced tools and technologies that optimize incident handling.
What Is Time to Resolution?
Time to Resolution (TTR) measures the total elapsed time from when an incident is first reported or detected until it is fully resolved. In other words, it’s the clock that starts ticking at issue detection and stops when the root cause is fixed and the system or service is restored to its normal operation.
Resolution means the problem is not only mitigated temporarily but addressed in a way that prevents recurrence-this is a crucial distinction. For example, a quick patch might allow service to resume, but the issue isn’t truly resolved until underlying bugs or infrastructure flaws are fixed, and clean-up or preventative measures are in place.
Notably, TTR encompasses all phases of incident management-from initial diagnosis, through troubleshooting and repair, to verification and cleanup. It reflects the entire resolution lifecycle, involving multiple teams, steps, and sometimes complex coordination.
In many systems, TTR can be further segmented into:
- Response Time: Time from incident report to first acknowledgment or action.
- Resolution Time: Time from incident report to final fix and closure.
Understanding the exact definition in your organization matters, as some may define it narrowly (time to “restore”) while others emphasize mean time to resolution as encompassing thorough problem-solving.
Let’s explore why TTR has become a non-negotiable KPI in customer support.
How to Calculate Time to Resolution
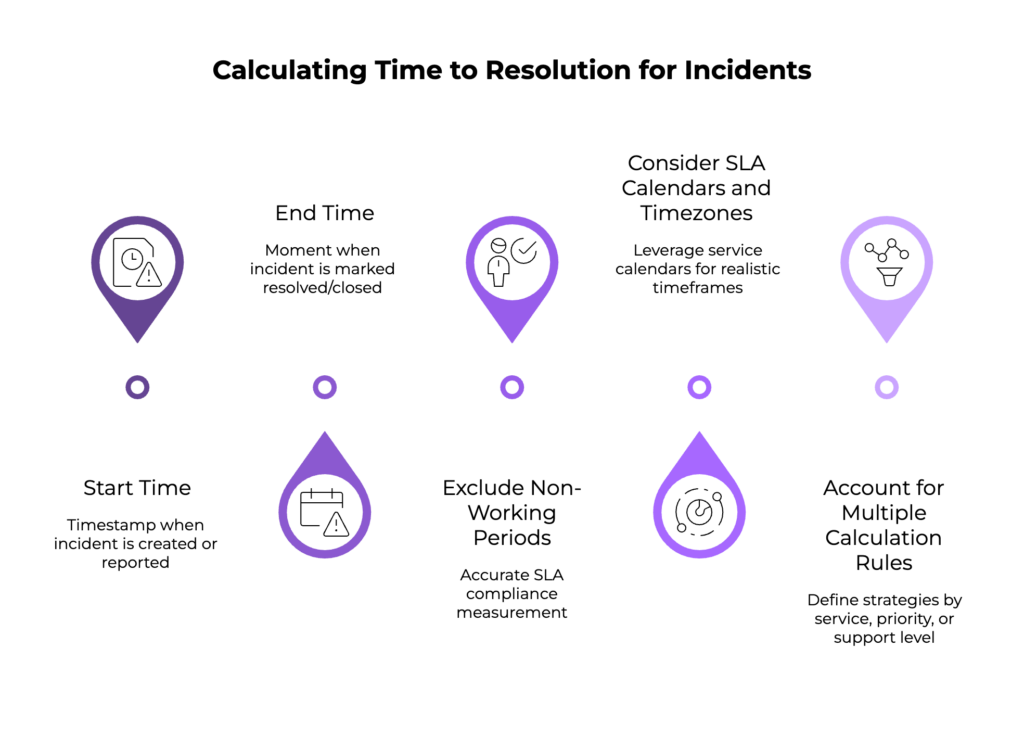
Calculating TTR accurately requires precise time-tracking of incident lifecycle stages and a sound definition of incident boundaries:
- Start Time: Typically the timestamp when the incident is created or reported in the system.
- End Time: Moment when the incident is marked resolved/closed with no outstanding issues.
- Exclude Non-Working Periods (If Applicable): Many organizations calculate TTR in business hours, excluding nights, weekends, and holidays for accurate SLA compliance measurement. For example, an incident created late Friday afternoon might only have active resolution time counted during the next business day.
- Consider SLA Calendars and Timezones: TTR calculations often leverage service calendars reflecting working hours and regional differences. Tools like Creatio automate this by applying calendars and SLA rules to convert calendar time into realistic working timeframes.
- Account for Multiple Calculation Rules: Organizations can define multiple calculation strategies, such as by service, priority, or support level, with fallback rules to ensure deadlines are determined even if one path fails.
Example:
An incident logged at 4:00 PM on Friday with a resolution time of 8 work hours will ideally resolve by 12:00 PM the following Monday, assuming a 9-to-5 business calendar excludes weekend time.
Industry Benchmarks for Time to Resolution
A “good” TTR is not a single number. It depends on your industry, your support channel, and what your customers have come to expect.
The cross-industry average across all support operations sits at approximately 24.2 hours. That figure covers everything from a two-minute live chat to a five-day technical escalation, so it is most useful as a baseline, not a target.
By industry
Here is where average TTR lands across the sectors where benchmarking data is most reliable. Use these numbers to calibrate internal targets, not to declare success.
| Industry | Avg TTR | Primary channel |
| SaaS / Technology | 12–24 hours | Email + ticket |
| Ecommerce | ~24 hours | Email + chat |
| Financial Services | ~25 hours | Email + phone |
| Telecommunications | 48–72 hours | Phone + ticket |
| IT Service Desk | 8.85 business hours | Ticket |
| Cross-industry average | ~24.2 hours | All channels |
By channel
Channel matters as much as industry. Customers hold live chat to a different standard than email, and their tolerance for delay shifts accordingly.
| Channel | Avg TTR | Customer expectation |
| Live chat | Under 10 min (simple) | Immediate |
| 12–24 hours | Within 24 hours | |
| Phone | Same call or callback | Immediate resolution |
| Social media | 1–4 hours | Under 1 hour |
| Messaging (WhatsApp) | Under 5 minutes | Near-instant |
What these numbers mean in practice
B2B support consistently runs longer than B2C. Complex technical tickets involve more stakeholders, more diagnostic steps, and more coordination across teams. A 24-hour TTR that would frustrate a retail customer is often perfectly reasonable in enterprise SaaS.
The channel your customer chooses also signals their urgency. Someone who opens a live chat expects near-instant resolution. Someone who sends an email is usually comfortable waiting a few hours. Meeting customers at channel-appropriate speeds is as important as hitting the aggregate average.
Use your industry benchmark as a floor, not a ceiling. The teams consistently gaining ground on CSAT are the ones treating these averages as the starting point and working back from customer expectation, not forward from internal capacity.
Why Is Time to Resolution Important?

TTR is a paramount Key Performance Indicator (KPI) for IT operations, customer support, and software teams because:
- Direct Impact on Customer Satisfaction: The duration a customer or user is affected by an issue directly correlates with their satisfaction.
- Financial Consequences: Downtime or degraded performance translates to lost revenue, operational inefficiencies, and potential contractual penalties in Service Level Agreements (SLAs).
- Operational Efficiency: Fast resolution reduces the amount of follow-up work, rework, and resource strain on technical teams, freeing them to focus on innovation instead of firefighting.
- Risk Management: A quick resolution lowers the exposure window when security breaches or compliance risks could be exploited.
- Supports Continuous Improvement: Tracking TTR highlights process weaknesses and enables targeted training, tooling investments, or workflow optimizations.
In essence, TTR acts as a health indicator for your incident response and resolution mechanisms. Ignoring it can cause persistent bottlenecks, ongoing customer frustration, and a lack of trust in your product or service.
The importance is clear — now, let’s look at the measurable benefits.
Benefits of Measuring Time to Resolution
Measuring TTR systematically offers several well-documented benefits:
- Identifies Bottlenecks and Inefficiencies: By analyzing TTR trends, organizations can pinpoint slow phases in incident management, such as lack of effective monitoring or delayed escalation.
- Supports SLA Compliance and Contract Management: Enables accurate reporting and SLA adherence, fostering transparency with customers and partners.
- Facilitates Resource Planning and Prioritization: Knowing typical TTRs helps allocate appropriate staff, schedule shifts, and prioritize high-impact incidents.
- Drives Accountability: Clear TTR metrics help in defining roles during incident response, encouraging ownership.
- Encourages Data-Driven Improvements: Regular review of TTR data informs investment in automation, monitoring, and training.
- Enables Benchmarking: Organizations can compare their performance against industry standards, set realistic improvement targets, and track progress over time (e.g., MetricNet’s global benchmarks).
Without measuring TTR, teams operate in the dark, guessing at pain points instead of addressing the root causes effectively.
Clearly defining and automating TTR calculation safeguards consistency and fairness in reporting. How does your organization’s TTR compare to the industry?
Average Time to Resolution (TTR) and Benchmarks
Understanding industry standards and averages provides useful context to evaluate your team’s performance against peers.
- Average TTR: Per MetricNet’s global data for desktop IT support, the average incident resolution time is approximately 8.85 business hours, with observed ranges from as low as 0.6 hours to as high as 27.5 hours depending on organizational factors.
Factors Influencing TTR:
- User Density: High-density office environments lower travel or coordination time and reduce TTR.
- Geographic Distribution: Spread-out user bases increase technician travel and coordination time, lengthening TTR.
- Incident Complexity: Complex multi-system outages naturally require longer resolution cycles.
- Setting Benchmarks: Understand your typical incident types and complexity to set realistic TTR targets. For example:
- Critical incidents: Target resolution within 30 minutes to 2 hours.
- Medium-impact incidents: May warrant 4-8 hours.
- Low-impact incidents: Can range up to multiple business days.
Benchmarking against averages like MetricNet’s can reveal where your teams stand and highlight opportunities for improvement.
Let’s clarify how MTTR complements (but doesn’t replace) TTR.
Understanding Mean Time to Resolution (MTTR)
MTTR is a statistically averaged form of TTR, focusing on the mean time it takes to resolve incidents over a period.
- Multiple Definitions: Originally from manufacturing (machine repair), in IT and DevOps circles MTTR is now understood chiefly as either mean time to restore or mean time to resolution.
- Mean Time to Restore focuses on the immediate recovery effort (getting the system back up).
- Mean Time to Resolution is broader, emphasizing full problem remediation including permanent fixes and cleanups.
- MTTR as an Indicator, Not a Panacea: It’s an average, which can be skewed by outliers-either very trivial or extraordinarily challenging incidents.
- Complement with Other Metrics: Best practice suggests using MTTR alongside error budgets, service availability percentages, and incident severity weights to get a full picture.
- Statistical Insights: MTTR alone doesn’t capture timing impact nuances, like whether problems occur during peak hours-a critical consideration as downtime at peak can cost more.
By understanding the statistical nature and limitations of MTTR, organizations avoid “quick fix” mentality and focus on sustainable reliability improvements.
Differences Between Time to Resolution and Related Metrics
Time to Resolution is one of several closely related support metrics. Each one measures a different part of the support experience. Using them together gives a complete picture of team performance. Confusing them gives a misleading one.
Here is how TTR compares to the metrics it is most commonly grouped with.
Time to Resolution vs First Contact Resolution (FCR)
| FCR | Measures quality, not speed
First Contact Resolution is the percentage of tickets fully resolved in a single interaction, with no follow-up, no callback, no reopened ticket. It answers: “Did we get it right the first time?” Industry benchmark for strong FCR sits at around 70% (GlowTouch benchmarking data). |
| vs TTR | TTR measures how long resolution takes. FCR measures whether it happened in one touch. A ticket can have excellent TTR (resolved in 2 hours) but poor FCR (required three separate contacts). A ticket can have perfect FCR (resolved in one call) but poor TTR (that call came 18 hours after the ticket opened). Both matter. Neither substitutes for the other. |
| Why FCR and TTR are complementary, not interchangeable |
| Research by SQM Group shows a 47% difference in CSAT when issues are resolved in one contact versus four or more. Each additional interaction needed drops customer satisfaction by an average of 16%. A support operation optimising only for TTR can hit resolution time targets while still generating repeat contacts and eroding satisfaction. Track both. |
Time to Resolution vs First Response Time (FRT)
| FRT | Measures acknowledgment speed, not resolution
First Response Time is the elapsed time between a customer submitting a ticket and receiving the first reply from an agent or system. It tracks how quickly your team picks up a ticket, not how quickly they close it. Industry FRT targets: under 40 seconds for live chat; under 4 hours for email; under 1 hour for social media (Lorikeet, 2026 benchmarks). |
| vs TTR | FRT ends when the first reply is sent. TTR ends when the ticket is closed. A fast FRT that is not followed by effective work simply delays frustration. A slow FRT with a fast TTR leaves the customer anxious during the wait but satisfied by the speed of resolution once work begins. Both metrics matter, but for different failure modes: FRT catches abandonment risk; TTR catches overall operational efficiency. |
Time to Resolution vs Mean Time to Resolution (MTTR)
| MTTR | The aggregate average of individual TTRs
Mean Time to Resolution is the mathematical average of all TTR values across a defined time period. If ten tickets resolve in 2, 4, 6, 3, 8, 5, 7, 1, 9, and 5 hours respectively, the MTTR is 5 hours. MTTR is how most teams report performance at the team or department level. |
| vs TTR | TTR is the individual ticket measurement. MTTR is the aggregate. TTR feeds MTTR. When reviewing operational health, use MTTR. When diagnosing a specific escalation or identifying outlier tickets dragging the average up, look at individual TTR values. MTTR can mask problems: a handful of extreme outliers can make an otherwise strong team look slow. |
Time to Resolution vs Mean Time to Acknowledge (MTTA)
| MTTA | Measures how quickly the team picks up a ticket
Mean Time to Acknowledge is the average time between a ticket being created and a human agent claiming or acknowledging it. It is the gap between a ticket entering the queue and someone taking ownership. High MTTA often signals routing problems, understaffing, or queue management issues. |
| vs TTR | MTTA captures the idle time before work starts. TTR captures the total time from start to close, including MTTA. In a well-run support operation, MTTA is small relative to TTR because most time is spent on actual resolution work, not waiting for someone to claim the ticket. A team with good TTR but high MTTA is resolving tickets quickly once they pick them up, but leaving too many untouched for too long. |
Using these metrics together
No single metric tells the complete support story. The combination reveals what individual numbers hide:
- High TTR + low FRT: Team acknowledges quickly but gets stuck during resolution. Points to knowledge gaps, routing issues, or complexity problems.
- Low TTR + low FCR: Team closes tickets fast but customers keep coming back. Points to shallow resolutions that do not address the root cause.
- Good MTTR + high MTTA: Once tickets are picked up, agents resolve them efficiently. The problem is the queue management layer, not the agents themselves.
- Low FCR + long TTR: Tickets are both slow to resolve and frequently require multiple contacts. The support process needs structural attention across routing, training, and tooling.
What Causes High Time to Resolution
A high TTR is always a symptom. These are the most common root causes.
1. Poor ticket routing
When tickets land with the wrong team or the wrong agent, resolution time doubles before any work even starts. A billing question routed to a technical engineer requires reassignment, context transfer, and re-explanation. Each handoff adds time and adds friction for the customer.
Skills-based routing, automatic classification, and AI triage all reduce this problem. The signal to watch for is a high number of ticket transfers or reassignments in your reporting data.
2. Gaps in the knowledge base
Agents who cannot find the answer to a recurring question have three options: escalate, research independently, or ask a colleague. All three add time. A well-maintained knowledge base turns common queries into near-instant resolutions. A poorly maintained one turns every familiar question into a fresh investigation.
Track the types of tickets that consistently take longest. A pattern of long TTR on the same topic categories almost always points to a knowledge gap.
3. Ticket complexity and escalation requirements
Not all tickets are equal. A password reset resolves in under a minute. A multi-system integration failure can take days. High complexity tickets that land in a general queue — instead of routing directly to senior agents or engineering — accumulate waiting time before the right person even looks at them.
Segmenting tickets by complexity at intake, rather than after the first response, removes this waiting cost from the resolution clock.
4. Understaffing against ticket volume
Even experienced, well-equipped agents hit a ceiling when queue depth exceeds capacity. Backlogs compound: a ticket that arrives at 9am and is not touched until 2pm already carries five hours of avoidable TTR before the agent has done anything wrong.
This is where AI autonomous resolution changes the math. Resolving 70 to 80 percent of tickets without human intervention does not just reduce those tickets’ TTR. It reduces queue pressure for every remaining ticket handled by a human agent.
5. Context loss during escalation
When a ticket escalates from tier 1 to tier 2, the receiving agent often starts from the beginning. The customer repeats the problem. The agent re-reads the history. Time passes without forward progress. A unified customer view that carries full conversation history, account context, and prior resolution attempts into the escalation eliminates this starting-over cost.
SQM Group research shows customer satisfaction drops by an average of 16 percent for each additional interaction required to resolve an issue. Context loss is not just an efficiency problem. It is a satisfaction problem.
6. Slow cross-team coordination
Technical issues frequently require input from product, engineering, or third-party providers. When support teams have no structured way to loop in those stakeholders, tickets sit in holding patterns waiting for information. Internal SLA agreements between support and engineering, combined with defined escalation paths, replace informal waiting with accountable timelines.
|
Common Challenges in Measuring and Managing Time to Resolution
Despite its value, managing TTR in the real world presents some major challenges. Accurately measuring and managing TTR faces several real-world hurdles:
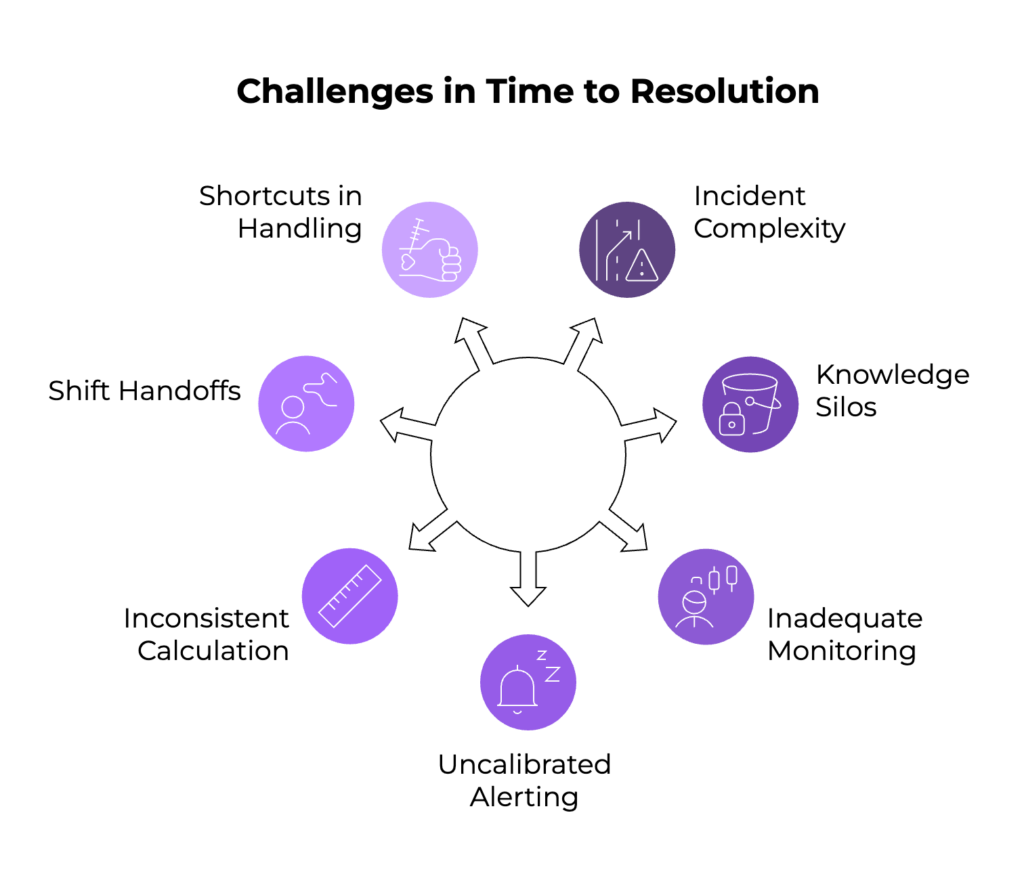
- Incident Complexity and Troubleshooting: Modern software systems are complex and distributed. Without deep visibility into system health, teams spend excessive time diagnosing the root cause, inflating TTR.
- Knowledge Silos and Team Dependencies: If incident knowledge rests with a few key specialists, delays occur when they’re unavailable, leading to longer resolution times.
- Inadequate Monitoring: Lack of real-time telemetry forces teams to guess symptoms and causes, increasing TTR dramatically.
- Uncalibrated Alerting: Poorly tuned alert thresholds cause alert fatigue, making engineers slow to respond or cherry-pick incidents, delaying resolutions unnecessarily.
- Inconsistent Calculation Rules: Without standardized ways to measure TTR-especially across teams or regions-reported metrics are not comparable or actionable.
- Shift Handoffs and Timezones: Incidents spanning multiple time zones or shift changes can experience communication breakdowns or lost momentum.
- Shortcuts in Incident Handling: Quick “band-aid” fixes may reduce immediate visibility of problems, but lead to recurring incidents and artificially shortened TTR that destabilizes availability in the long run.
Tackling the challenges means applying smarter systems. Let’s look at proven strategies for reducing resolution time at scale.
Kayako equips you to respond, reassure, and retain.
Strategies to Improve and Reduce Time to Resolution
Reducing TTR sustainably requires a balanced approach that combines technology, process, and human factors. Key strategies include:
- Build a Robust Incident Management Framework
-
- Establish clear escalation policies with defined roles (incident commander, technical leads, communications leads).
- Adopt fluid, collaborative, and continuously evolving workflows as recommended by New Relic, moving away from rigid or ad-hoc models.
- Engage in regular cross-training: ensure multiple team members can fulfill critical incident roles, avoiding single points of failure.
- Use runbooks and playbooks to share institutional knowledge and guide responders step-by-step, reducing hunting time for solutions.
- Invest in Comprehensive Monitoring and Observability
-
-
- Deploy end-to-end application and infrastructure monitoring to gather real-time data on system health, response times, error rates, and resource utilization.
- Instrument distributed tracing to quickly isolate latency and bottlenecks in microservices.
- Visualize Kubernetes or container orchestration layers to spot infrastructure issues fast.
-
- Leverage AIOps and Automation
-
- Use AI-powered tools to prioritize, correlate, and suppress noisy alerts, focusing human attention on critical incidents.
- Implement automated remediation workflows where feasible to instantly clear known issues and reduce manual toil.
- Calibrate Alerts Carefully
-
-
- Set threshold-based alerts on Service Level Indicators (SLIs) such as throughput, error rates, or latency.
- Use muting rules to avoid alert fatigue during maintenance windows or noisy transient conditions.
-
- Embrace Continuous Incident Learning
-
- Conduct blameless postmortems to understand root causes, contributing factors, and gaps in detection.
- Implement “don’t repeat incidents” (DRI) policies stopping all new work on a broken system until fully fixed.
- Use chaos engineering to simulate failures and rehearse incident response before real problems occur.
- Align SLA and Time Calculation Rules with Business Needs
-
- Define response and resolution deadlines based on service priorities, user impact, and business hours.
- Automate deadline calculations incorporating calendars, time zones, and case priorities for consistency.
Ultimately, every internal improvement reflects in customer experience. What does faster resolution mean for your customers?
The Impact of Time to Resolution on Customer Experience and Satisfaction
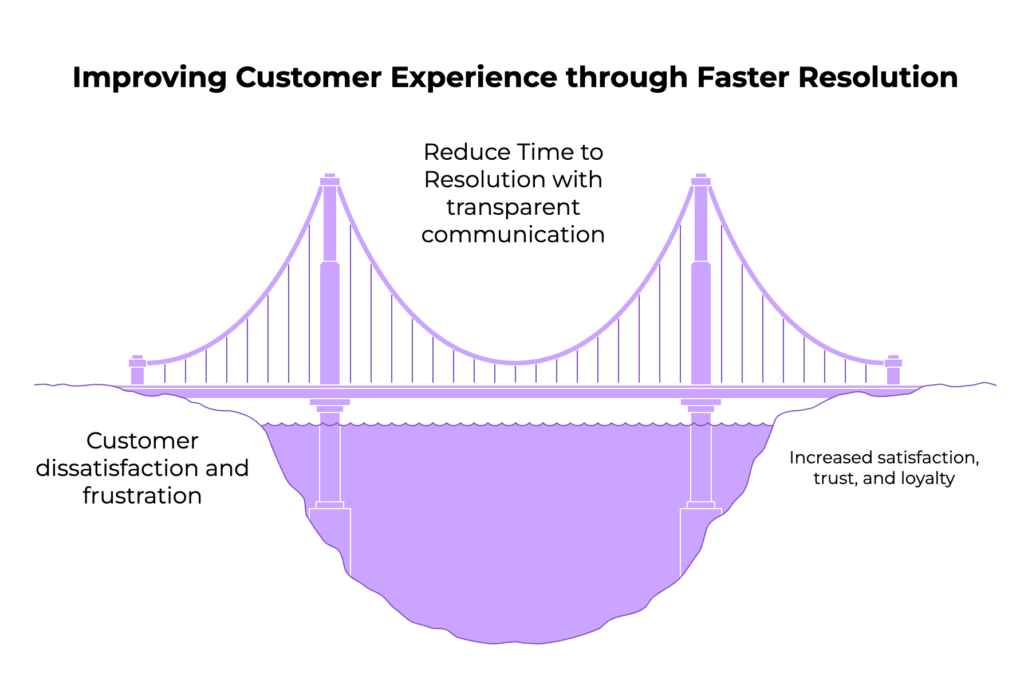
Customers equate their product or service experience with your ability to resolve issues quickly-whether it’s a software bug blocking workflow or network downtime.
- Faster TTR means users spend less time frustrated or stuck, translating into higher satisfaction scores as evidenced by industry data (MetricNet).
- Effective incident resolution strengthens customer trust and loyalty.
- Conversely, slow or inconsistent resolution erodes confidence, leading customers to consider competitors.
- Transparent communication during incidents, enabled by well-defined roles (e.g., communication lead), also buffers negative sentiment.
- For service desks and desktop support teams, MTTR correlates directly with user productivity and morale.
Thus, improving TTR isn’t just operational; it is a core element of customer experience management.
Tools and Technologies to Optimize Time to Resolution
The right tech stack can dramatically cut resolution time while improving team focus. Modern toolsets empower teams to manage TTR professionally:
- Kayako: With AI-powered suggestions, real-time ticket summaries, and SingleView™ customer context, agents spend less time searching and more time solving. From repetitive triage to complex workflows, Kayako automates the grind and accelerates outcomes
- Observability Platforms: Such as New Relic One, which offer comprehensive application monitoring, distributed tracing, log analysis, and real-time dashboards.
- AIOps Suites: Incorporate machine learning to detect anomalies, reduce noise, suggest root causes, prioritize incidents, and automate workflows (New Relic AI capabilities).
- Alerting Systems: Provide flexibly defined alerts with muting, escalation, and notification policies to minimize fatigue and ensure timely response.
- Incident Management Systems: Enable tracking, accountability, escalation workflows, and SLA enforcement.
- Runbook Automation: Integrated with incident tooling to guide responders through procedures, including automated playbook execution.
- Cross-Team Communication Tools: Slack, Microsoft Teams, integrated with alerting and monitoring for rapid collaboration.
- Chaos Engineering Tools: E.g., Gremlin, to test resilience and train teams.
By selecting tools that unify monitoring, alerting, and collaboration, organizations can shorten TTR and improve operational visibility.
Let Kayako handle the complexity
Case Studies and Examples of Effective Time to Resolution Management
Real-world examples offer valuable lessons in building a more resilient incident response strategy.
Example 1: New Relic’s MTTR Reduction Best Practices
New Relic’s approach to reducing MTTR focuses on building an incident management strategy encompassing:
- Multi-dimensional system health monitoring.
- Clear incident command structure with flexible role rotation.
- Cross-training engineers to avoid dependencies.
- Carefully calibrated alerting with actionable thresholds.
- Leveraging New Relic AI to surface root causes, suppress noise, and automate remediation.
This yields faster, smarter incident response and sustainable improvements in resolution times.
Example 2: Creatio SLA Time Calculation for Support Cases
Creatio’s platform exemplifies best practices in deadline calculation for service desks:
- Supports multiple SLA strategies based on service, priority, and support levels.
- Incorporates working calendars that define business hours, holidays, and timezones.
- Offers detailed overdue and remaining time indicators on case pages for real-time progress monitoring.
- Automatically recalculates deadlines based on changing case status, pauses, and resumptions.
- Ensures transparent customer communication and internal accountability
These success stories show what’s possible when process, tooling, and culture align around TTR.
Reducing MTTR the Right Way – Structural Health and Team Optimization
A critical insight from New Relic’s whitepaper highlights that simply speeding up fixes isn’t enough. Sustainable MTTR reduction requires:
- Structure Health: Understanding system complexity and performance holistically so that troubleshooting is not fragmented or guesswork.
- Team Optimization: Ensuring teams have cross-functional knowledge and clearly defined incident roles to minimize delays due to handoffs or expertise gaps.
- Avoiding Shortcuts: Resisting temptation to implement quick patches that superficially fix symptoms but allow issues to recur, thus inflating future MTTR.
- Monitoring as Foundation: Real-time monitoring data bridges the gap between detection and resolution, empowering actionable decisions.
Together, these factors constitute a healthy incident response ecosystem that drives durable TTR improvements.
Time to Resolution (TTR) is a defining metric for modern support teams. Faster resolution leads to stronger customer relationships, smoother operations, and better SLA performance. Delays in response create more than just downtime — they diminish trust and team momentum
By aligning people, process, and technology around reducing TTR, organizations can enhance service quality, build resilience, and maintain a competitive edge in customer experience.