Quick summary: Customer engagement metrics fall into four groups, behavioral, sentiment, outcome, and channel. The most predictive ones for retention are customer health score, product stickiness, NPS, CSAT, churn rate, and customer lifetime value. Track a small set tied to a clear goal, connect them to revenue, and act on the early-warning signals rather than admiring the numbers.
A customer stops opening your emails. They skip the last two product updates. They renew anyway, then churn three months later with no warning. The account looked fine on the revenue report the whole time. It was never fine. The early signals were sitting in your customer engagement metrics, and nobody was reading them.
Customer engagement metrics are the quantifiable measures of how deeply, how often, and how positively customers interact with your brand across every touchpoint. Tracked well, they tell you which accounts are pulling away long before the invoice does. Tracked badly, they turn into a dashboard nobody trusts. This guide covers the metrics worth measuring, the formulas behind them, and how to turn each one into action.
What are customer engagement metrics?
Customer engagement metrics measure the strength of the relationship between a customer and your brand over time. They go past a single purchase and look at participation, how a customer uses the product, responds to outreach, gives feedback, and keeps coming back.
The distinction that matters here is between engagement and vanity. A big follower count or a spike in page views feels good, yet neither tells you whether a customer will renew. A real engagement metric maps to a behavior or sentiment that correlates with revenue, retention, or advocacy. If a number goes up and nothing about the business improves, it is decoration.
Academic work backs this framing. In their widely cited paper in the Journal of the Academy of Marketing Science, Pansari and Kumar define customer engagement through both direct contributions, such as purchases, and indirect ones, such as referrals and feedback. Good metrics capture both sides. So before you pick a single KPI, decide which behavior you actually want more of.
The test for any metric: if this number moved 20% tomorrow, would a revenue, retention, or advocacy outcome move with it? If not, it does not belong on your dashboard.
Once you can name the behavior a metric stands for, the reason to track it at all becomes concrete. That is the case the next section makes.
Why customer engagement metrics matter?
Engagement metrics matter because they are the earliest read you get on future revenue. Sentiment slips before spend does. Usage drops before a cancellation email arrives. A team that watches these signals gets weeks or months of lead time to save an account.
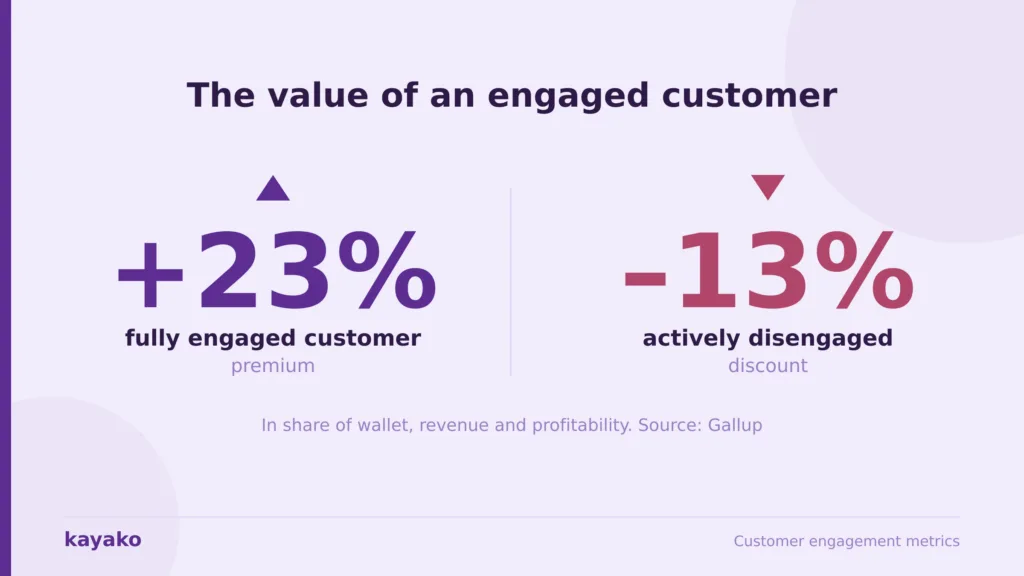
The money behind that is well documented. Gallup found that a fully engaged customer delivers a 23% premium in share of wallet, profitability, and revenue over the average customer, while an actively disengaged one represents a 13% discount. The gap between your most and least engaged customers is not a rounding error. It is roughly a third of the relationship’s value.
Expectations have risen too. Salesforce reports that 88% of customers say the experience a company provides matters as much as its products. Meanwhile, Bain & Company research shows that lifting retention by just 5% can raise profits by 25% to 95%. Engagement metrics are how you spot the retention risk early enough to do something about it.
The opportunity is largest in B2B, where engagement is often lowest. Gallup found that only 22% of B2B customers are engaged, and just 13% are fully engaged, mostly because few companies work at the emotional side of the relationship. So the accounts your competitors are neglecting are the same ones your metrics can help you win.
The case is straightforward. These numbers turn a lagging revenue report into a leading indicator. That is worth building a system around, and the first step is knowing which numbers, because engagement metrics sort into four distinct groups.
See how Kayako reads customer signals
The four categories of engagement metrics
Most engagement metrics fall into one of four groups. Sorting them this way keeps your dashboard balanced, because a healthy read on engagement needs all four rather than five versions of the same thing. The four categories are behavioral, sentiment, outcome, and channel-specific.
Behavioral metrics
Behavioral metrics track what customers actually do inside your product or across your touchpoints. They include daily, weekly, and monthly active users, product stickiness, feature adoption, session duration, and visit frequency. These are your most objective signals, because they record real actions rather than opinions.
The headline behavioral metric for many teams is stickiness, calculated as daily active users divided by monthly active users. A stickiness above roughly 20% suggests customers are building your product into their routine. When it slides, disengagement is usually already underway.
Sentiment metrics
Sentiment metrics capture how customers feel. The core three are Net Promoter Score, Customer Satisfaction, and Customer Effort Score, often paired with a rolling customer health score. Behavior tells you what happened, whereas sentiment tells you why, so the two categories work best read together.
For a deeper look at the survey mechanics, the NPS, CSAT, and Customer Effort Score guides break down the exact questions and scales. The key point here is that sentiment is directional, not absolute, so track the trend more than the single reading.
Outcome metrics
Outcome metrics connect engagement to money. They include churn rate, retention rate, customer lifetime value, activation rate, and conversion rate. These sit closest to the finance report, which makes them the metrics your leadership will care about most.
Because they lag behind behavior and sentiment, outcome metrics confirm what the earlier signals predicted. If churn rises after stickiness fell, the story is consistent, and customer lifetime value tells you how much each saved account is worth defending.
Channel-specific metrics
Channel-specific metrics measure engagement within a single medium. Email open and click rates, social interactions, live-chat response times, and support-ticket volume by channel all live here. They matter because a customer can be highly engaged on one channel and invisible on another.
Read in isolation, a channel metric can mislead. A rising email click rate looks great until you notice product usage falling. So treat these as inputs to the bigger picture rather than the picture itself. That balance sets up the full metric list below.
15 customer engagement metrics to track (with formulas)
The list below covers the fifteen metrics most teams should know, grouped by the four categories. Each includes what it measures and how to calculate it. You will not track all fifteen at once, and the section after this explains how to choose. For now, here is the working vocabulary.
Behavioral: activity, stickiness, and adoption
- Daily / weekly / monthly active users (DAU/WAU/MAU): the count of unique users active in a day, week, or month. The raw pulse of usage.
- Product stickiness: DAU divided by MAU, shown as a percentage. Above 20% signals habitual use.
- Feature adoption rate: users who adopt a feature divided by users who could, times 100. Shows whether value is spreading.
- Session frequency and duration: how often customers return and how long they stay. Rising frequency usually beats rising duration.
These four answer one question: are customers building your product into their week? When the answer weakens, act before the sentiment scores catch up.
Sentiment: how customers feel
- Net Promoter Score (NPS): percentage of promoters minus percentage of detractors, on a 0 to 10 recommend question. A relationship-level loyalty read.
- Customer Satisfaction (CSAT): positive responses divided by total responses, times 100. Best for a specific interaction.
- Customer Effort Score (CES): average ease rating, usually on a 1 to 7 scale. Lower effort strongly predicts loyalty.
- Customer health score: a weighted blend of usage, sentiment, and support signals into one 0 to 100 number. Your single best early-warning metric.
One caution on NPS. Marketing Science Institute research covering more than 250,000 ratings found that NPS explains only about 1% of the variance in customer spending. So use it as a directional loyalty signal, and pair it with behavior and outcome metrics rather than treating it as the whole story.
▶ How to calculate and read NPS
A short primer on turning promoter and detractor percentages into a score you can act on.
Outcome: retention, value, and conversion
- Churn rate: customers lost in a period divided by customers at the start, times 100. The metric every other one is trying to prevent.
- Retention rate: the inverse view, customers kept over the period. Small gains compound fast.
- Customer lifetime value (CLV): average revenue per customer times average lifespan. Sets how much you should invest to keep them.
- Activation rate: new users who reach a first value moment divided by all new users. Weak activation quietly feeds later churn.
- Conversion rate: desired actions divided by opportunities, times 100. Applies at every stage, from trial to upsell.
These are the numbers your board recognizes. Tie them back to the behavioral signals, and you can show why retention moved rather than just reporting that it did.
Channel: engagement by medium
- Email engagement: open rate and click-through rate. A quick read on whether outreach still lands.
- Support and channel engagement: ticket volume, first response time, and resolution rate by channel. High-effort support drags every other metric down.
Channel metrics round out the set. For the support side specifically, the customer support metrics guide goes deeper on response and resolution benchmarks. Next, the harder question: which of these fifteen should you actually track?
Which metrics to track by lifecycle stage and by team
Tracking all fifteen metrics at once buries the signal you need. The better approach maps a short list to where the customer is in their lifecycle and to which team owns the outcome. That way each group watches the two or three numbers it can actually move.
By lifecycle stage, the priorities change. During onboarding, activation rate and time to first value matter most. In the adoption phase, stickiness and feature adoption take over. Through renewal, health score, NPS, and churn risk lead. In the advocacy stage, referral and expansion metrics come to the front.
By team, ownership splits cleanly. Product watches stickiness, feature adoption, and activation. Support tracks CSAT, CES, first response time, and resolution rate. Success owns health score, churn, and expansion. Marketing follows email and campaign engagement. When each team has its own scoreboard, the shared health score stays honest because every input has an owner. Choosing the right set is half the job, though. Acting on it is the other half, which is where measurement turns into results.
Rule of thumb: one north-star engagement metric for the company, plus two or three supporting metrics per team. More than that, and nobody knows which number to move first.
How to measure and act on engagement metrics
Collecting metrics is the easy half. Acting on them is where most programs stall. A measurement system earns its keep only when a change in a number reliably triggers a change in behavior on your side.
Start by choosing a north-star metric that best represents value for your business, often health score or stickiness. Connect your data sources so product usage, support history, and survey results sit in one view rather than three tools. Then set thresholds that trigger action, so a health score dropping below a set line routes the account to a success manager automatically.
Common mistakes to avoid
A few patterns quietly break engagement programs. Teams track everything, so no single number gets attention. Surveys go out so often that response rates collapse. Data stays siloed across tools, so nobody sees the full account. And a single metric gets read in a vacuum, so a healthy NPS masks falling usage underneath.
The fix for each is the same discipline: fewer metrics, one shared view, and every reading interpreted alongside its neighbors. Measuring the right things, and connecting them to the customer experience metrics that leadership already watches, keeps the program credible. From here, automation changes what is possible.
One more habit separates strong programs from busy ones. Every metric review should end with a decision, not a nod. If a health score dropped, someone owns the outreach. If activation slipped, product owns the fix. A number that never changes anyone’s week is a number worth cutting.
How AI is changing engagement measurement in 2026
AI has moved engagement measurement from reporting the past toward predicting the next move. Instead of a monthly health score, teams now run rolling scores that update as behavior changes, and models flag at-risk accounts before a human would notice the pattern.
Three changes stand out. Predictive churn scoring reads dozens of signals at once and ranks accounts by risk. Sentiment analysis reads open-text feedback and support conversations at scale, so you learn why a score moved without manually tagging responses. And resolution metrics now sit alongside engagement, because an AI that resolves a customer’s issue instantly removes a detractor and creates a potential promoter in the same moment. Pulling that measure-and-act loop into one system is exactly where a platform like Kayako earns its place.
Personalization gains follow the same pattern. McKinsey found that well-timed, targeted communications can lift sales by 1% to 2% and margins by 1% to 3%, and that gain depends on reading engagement signals accurately in the first place. So better measurement and better action now feed each other.
How Kayako helps you track and act on engagement
Most engagement blind spots come from scattered data. Usage sits in the product, sentiment in a survey tool, and support history in a separate inbox, so no single view shows the whole account. Kayako’s SingleView pulls a customer’s events, history, and conversations into one place, which is the precondition for any health score worth trusting. The customer engagement platform category exists to close exactly this gap.
The support side compounds the effect. When Agent Kay resolves routine tickets autonomously, first response time and resolution rate improve, and each fast resolution nudges CSAT and NPS upward rather than down. The results show up in the numbers. Trilogy used Kayako to eliminate 80% of its ticket volume, cut ticket age from 17.6 hours to under 2 minutes, and save $5 million, reaching autonomous resolution across most of its queue within a 90-day rollout.
Read as an engagement story, that case is about removing the friction that drives detractors, then measuring the sentiment and retention gains that follow. The measurement and the action live in the same system, which is the point.
Customer engagement metrics earn their place when they give you lead time. Behavioral signals tell you what customers do, sentiment scores tell you how they feel, outcome metrics confirm the revenue effect, and channel metrics show where the relationship lives. Track a focused set across those four groups, tie each to a clear goal, and give every number an owner.
The teams that win are not the ones with the most dashboards. They are the ones that read a falling health score and act on it the same week. Start with a north-star metric, connect your data, and build the habit of responding to early signals. The retention gains follow from there.
Frequently asked questions
What are the most important customer engagement metrics?
For most teams, the highest-value metrics are customer health score, product stickiness, NPS, CSAT, churn rate, and customer lifetime value. Health score and stickiness give the earliest warning, the sentiment scores explain the why, and churn and lifetime value quantify the revenue at stake. Start with those six and add others only when a specific decision needs them.
How do you measure customer engagement?
Measure it across four categories at once: behavioral metrics for what customers do, sentiment metrics for how they feel, outcome metrics for the revenue effect, and channel metrics for where they interact. Pick a north-star metric such as health score, connect product, survey, and support data into one view, and set thresholds that trigger action when a number crosses a line.
What is a good customer engagement score?
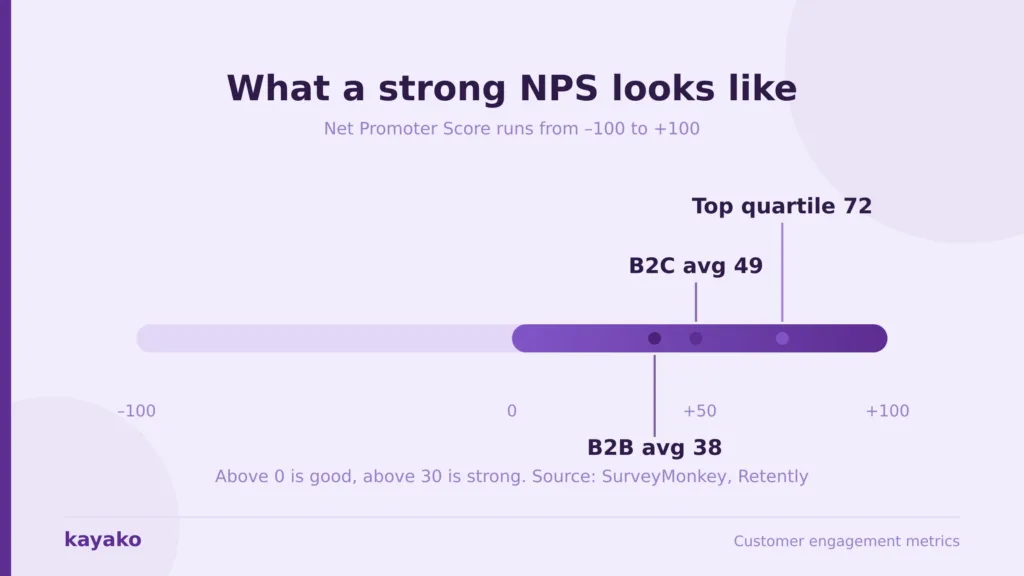
It depends on the metric and your industry. Product stickiness above 20% is a healthy sign of habitual use. For NPS, SurveyMonkey data across 150,000 organizations puts the average near 32, with the top quartile at 72 or higher, while Retently puts B2B around 38 and B2C near 49. Benchmark within your own industry before judging any single score.
What is the difference between NPS, CSAT, and CES?
NPS measures overall loyalty and likelihood to recommend, so it reads the relationship. CSAT measures satisfaction with a specific interaction, so it reads a moment. CES measures how much effort a customer spent to get something done, and low effort is one of the strongest predictors of repeat business. Most teams run all three, each at the point where it fits.
How often should you track customer engagement metrics?
Match the cadence to the metric. Behavioral metrics such as active users and stickiness are worth watching continuously or weekly, since they move fast. Sentiment surveys work better on a steady but spaced schedule, monthly or after key interactions, so response rates stay healthy. Outcome metrics such as churn and lifetime value settle into a monthly or quarterly review. Automation lets the fast-moving signals run in real time without survey fatigue.