
RICE prioritization scores each initiative on Reach, Impact, Confidence, and Effort, then ranks your options by a single number so the team builds what matters most first. This guide walks through the formula, a worked example, a reusable template, how RICE compares to ICE, WSJF, and MoSCoW, and how to apply it without fooling yourself about the estimates behind each score.
Most product teams do not fail because they build badly. They fail because they build the wrong things well. The evidence is uncomfortable: the Standish Group found that 64% of software features are rarely or never used, and a later Pendo analysis put the figure closer to 80% of features seeing low to no adoption. Every one of those features costs real engineering time that could have gone somewhere more valuable. A scoring method that forces honest trade-offs is how teams claw that time back.
RICE prioritization is one of the most widely used of those methods. It takes the gut-feel argument out of a roadmap meeting and replaces it with four factors you can score, compare, and defend. The result is a ranked list where the highest-value, lowest-effort work rises to the top. This guide explains where RICE came from, how the formula works, how to run the numbers, and where it helps and where it quietly misleads.
It is written for product managers, founders, and team leads who are tired of roadmap meetings that end with a decision nobody can explain a week later. RICE will not remove judgment from the process, and it should not. What it does is give that judgment a structure, so the reasoning behind a priority is written down in numbers everyone can see, question, and revise. If a stakeholder disagrees with the order, the argument becomes a specific one about a Reach figure or an Effort estimate rather than a clash of preferences.
What is the RICE prioritization framework?
RICE is a scoring model that ranks initiatives by four factors: Reach, Impact, Confidence, and Effort. The framework was created by Sean McBride on the product team at Intercom, who needed a consistent way to compare very different roadmap ideas without the loudest voice winning. Rather than debating features one against another, each idea gets a numeric score, and the scores set the order.
The appeal is that RICE weighs value against cost in a single calculation. Three of the factors estimate how much good an initiative will do, and the fourth estimates how much work it will take. Divide the first by the second, and you get a score that rewards high-value work you can ship quickly. That popularity is real: ProductPlan reports RICE among the most commonly used prioritization frameworks in its product management research, alongside methods like the Kano model and story mapping.
The reason scoring beats debate comes down to consistency. When ideas are argued one at a time, each gets evaluated against a different set of considerations, and the order that emerges reflects the sequence of the conversation as much as the merit of the work. A scoring model applies the same four questions to every candidate, so a small, certain improvement and a large, speculative bet are measured on the same terms. That does not guarantee the right answer, but it does guarantee a fair comparison, which is more than most roadmap discussions manage. Understanding each factor is the next step, so here is the formula in full.
The RICE formula explained
The RICE score is a single equation:
RICE score = (Reach × Impact × Confidence) ÷ Effort
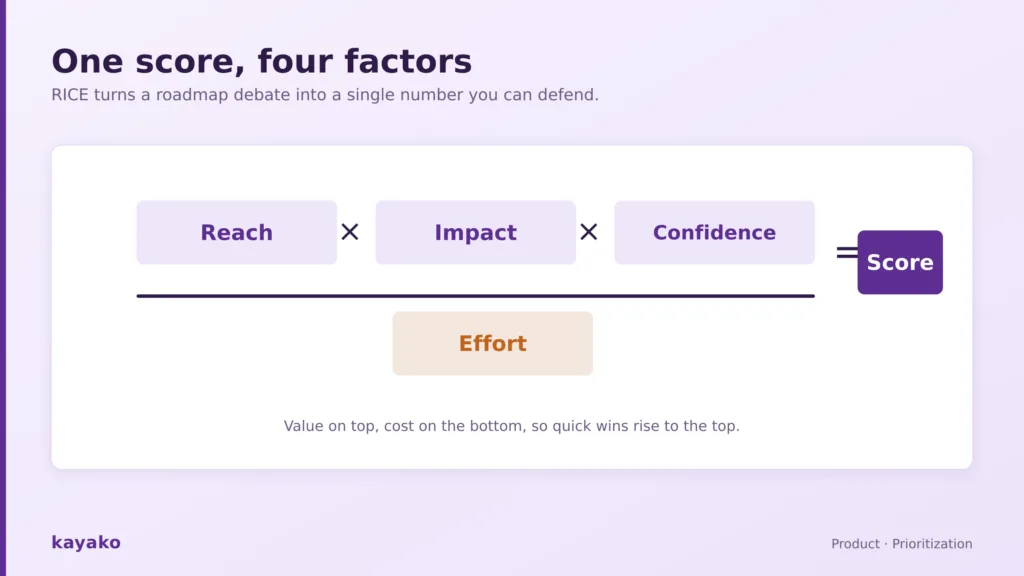
The RICE formula: value on top, effort on the bottom, so quick wins rise to the top.
Each factor uses its own scale, and the discipline of scoring them separately is where most of the value lives. Here is what each one means and how to score it.
Reach
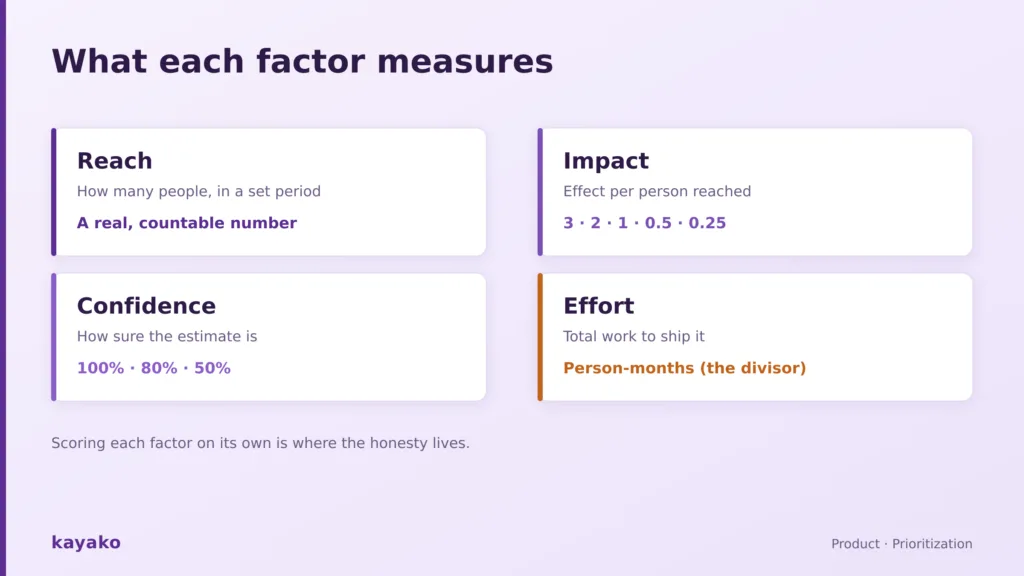
Reach estimates how many people an initiative will affect over a set period, such as customers per quarter or sign-ups per month. Use a real, countable number drawn from your own data rather than a vague sense of size. If a change touches 2,000 customers a quarter, its Reach is 2,000. Keeping Reach grounded in actual figures stops big-sounding ideas from crowding out quietly valuable ones.
Impact
Impact estimates how much the initiative will move the outcome you care about for each person it reaches. Because that effect is hard to measure precisely, RICE uses a fixed five-point scale: Massive counts as 3, High as 2, Medium as 1, Low as 0.5, and Minimal as 0.25. Assigning one of five values keeps the scoring consistent across very different ideas and stops anyone from inflating their favorite project with a made-up multiplier.
Confidence
Confidence is a percentage that discounts your own estimates when the evidence is thin. RICE uses 100% for high confidence backed by solid data, 80% for medium confidence, and 50% for low confidence that rests mostly on intuition. This factor exists because people are reliably overconfident about their own forecasts, a bias Daniel Kahneman documents at length in “Thinking, Fast and Slow.” A low Confidence score is the framework’s way of protecting the roadmap from a compelling story with no proof behind it.
Effort
Effort estimates the total work an initiative requires, measured in person-months across product, design, and engineering. It is the only factor in the denominator, which means a smaller Effort raises the score. That matters because engineering time is expensive: a five-person team can cost well over $750,000 a year fully loaded, so a project that ties up half of them for two months is a real financial commitment worth weighing with the same rigor as any margin calculation. Dividing value by Effort is what makes RICE reward quick wins over grand plans of uncertain payoff. With the factors defined, a worked example makes the calculation concrete.
RICE prioritization example (a worked calculation)
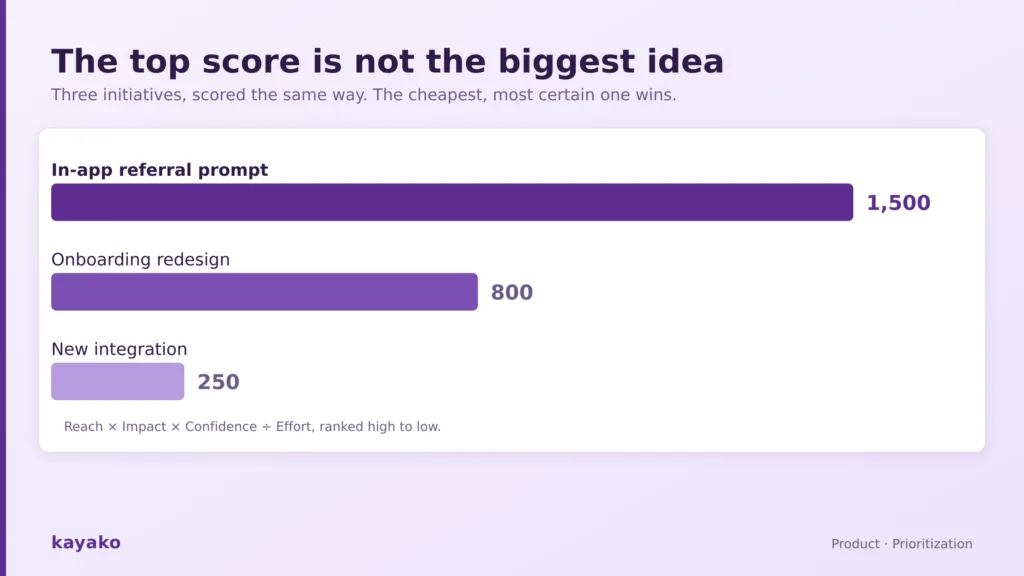
Suppose a product team is weighing three ideas: a redesigned onboarding flow, a new integration, and an in-app referral prompt. Scoring each on the four factors gives a table like this.
| Initiative | Reach | Impact | Confidence | Effort | RICE score |
|---|---|---|---|---|---|
| Redesigned onboarding | 2,000 | 2 | 80% | 4 | 800 |
| New integration | 500 | 3 | 50% | 3 | 250 |
| In-app referral prompt | 1,500 | 1 | 100% | 1 | 1,500 |
Running the numbers, the onboarding redesign scores (2,000 × 2 × 0.80) ÷ 4 = 800, the integration scores (500 × 3 × 0.50) ÷ 3 = 250, and the referral prompt scores (1,500 × 1 × 1.00) ÷ 1 = 1,500. The referral prompt wins, not because it is the most ambitious idea, but because it reaches a lot of people, the team is certain it will work, and it takes almost no effort to ship. That result would be easy to miss in a debate driven by enthusiasm, which is exactly the point of scoring.
The example also shows how the factors interact. The new integration scores lowest despite the highest Impact rating, because its 50% Confidence and three months of Effort drag the total down. If the team could raise that Confidence to 80% by validating demand first, the score would jump from 250 to 400, which might be reason enough to run a small discovery spike before committing to the build. Reading a RICE table this way, as a set of levers rather than a fixed verdict, is where the framework becomes a thinking tool rather than a scoreboard. To reuse this quickly, you need a template.
RICE prioritization template and calculator
A working RICE template is simply a spreadsheet with one row per initiative and one column per factor, plus a formula column that multiplies Reach, Impact, and Confidence and divides by Effort. Sort that column from high to low, and you have your ranked backlog. Building it yourself takes a few minutes, and it keeps the scoring visible to everyone who contributed. Add a short notes column next to each score to record the reasoning behind a Reach figure or an Effort estimate, because those notes are what let you audit a decision later, rather than re-litigating it from scratch.
A practical habit is to score the sheet as a team rather than alone. Have the person closest to the work propose each Effort estimate, the person closest to the customer propose each Reach and Impact, and the group agree on a Confidence level together. Scoring collaboratively surfaces disagreements early, while they are still cheap to resolve, and it means the final ranking carries the weight of shared input rather than one person’s assumptions.
Several product tools also include a built-in RICE calculator, so scores update as you edit the inputs. Productboard, airfocus, Aha!, and Roadmunk all offer some version of RICE scoring inside the roadmap itself, which saves exporting to a separate sheet. Whichever route you take, the template is only as good as the estimates you feed it, which is why comparing RICE to other frameworks is worth doing before you commit to it.
RICE vs other prioritization frameworks
RICE is not the only scoring model, and it is not always the right one. Teams often search for it alongside ICE, WSJF, and MoSCoW, so here is how it compares to each.
RICE vs ICE
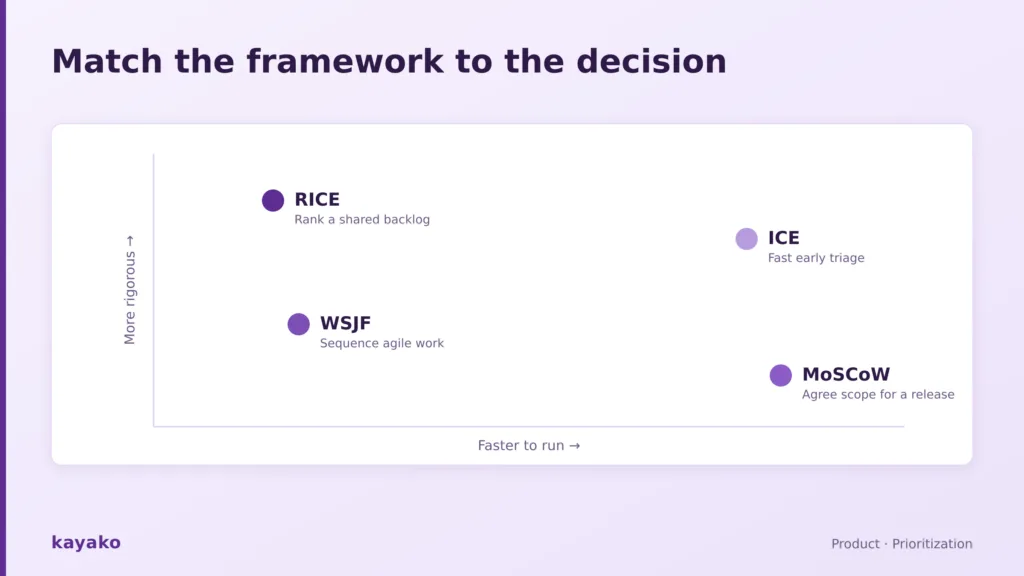
ICE scores initiatives on Impact, Confidence, and Ease, and multiplies the three together. It drops Reach and, crucially, has no Effort divisor, which makes it faster to run but cruder. ICE suits quick, early-stage triage where speed matters more than rigor, whereas RICE adds the reach and effort dimensions that make it more defensible for a shared roadmap.
RICE vs WSJF
WSJF, or Weighted Shortest Job First, comes from the Scaled Agile Framework and divides the Cost of Delay by the Job Size. It is built for agile release trains where sequencing time-sensitive work is the priority. RICE is more at home on a product roadmap where you are weighing customer value against build cost rather than scheduling around delay.
RICE vs MoSCoW
MoSCoW sorts work into Must have, Should have, Could have, and Will not have. It is categorical rather than numeric, which makes it a fast way to triage scope for a single release. RICE is quantitative and better suited to ranking a longer backlog, whereas MoSCoW shines when you simply need to agree on what is in and what is out.
Laid side by side, the four methods trade rigor against speed in predictable ways.
| Framework | What it scores | Numeric? | Best for |
|---|---|---|---|
| RICE | Reach, Impact, Confidence, Effort | Yes | Ranking a shared product backlog |
| ICE | Impact, Confidence, Ease | Yes | Fast early-stage triage |
| WSJF | Cost of Delay / Job Size | Yes | Sequencing agile release trains |
| MoSCoW | Must, Should, Could, Will not | No | Agreeing scope for one release |
The pattern is consistent: the more numeric the method, the more defensible its output and the more work it takes to run. RICE sits toward the rigorous end, which is why it suits decisions that need to survive scrutiny from people who were not in the room. If you are weighing decision frameworks more broadly, the same comparison logic applies to change management models, which help teams choose how to sequence and adopt work rather than which features to build. Once you have chosen RICE, applying it well takes a repeatable process.
How to use the RICE framework (step by step)
Turning RICE from a formula into a habit takes five steps, and the discipline is in doing them in order rather than jumping to a total you already favor.
- List every initiative you are weighing. Put competing ideas on one sheet so they are scored against the same yardstick.
- Score each factor separately. Work through Reach, Impact, Confidence, and Effort one column at a time to avoid anchoring on a total you already have in mind.
- Calculate the RICE score. Multiply Reach, Impact, and Confidence, then divide by Effort.
- Rank from high to low. The ordered list is your draft priority.
- Sanity-check, then revisit. If a result feels wrong, interrogate the inputs rather than overriding the score, and re-run as new data arrives.
One honest note on where this connects to customer-facing work: product and support teams can use the same scoring to decide which improvements or automations to build next, ranking fixes by how many customers they reach and how much effort they take rather than by who is shouting loudest. Prioritizing by real customer value, tracked through your support metrics, keeps the roadmap pointed at outcomes rather than opinions. That discipline is also where RICE earns both its praise and its criticism.
See which customer improvements to prioritize first with Kayako
Pros and cons of RICE
RICE is a useful tool, not a truth machine, and knowing its limits keeps you from trusting it too far.
What RICE does well:
- It reduces bias and politics. A number is harder to argue with than a strong personality, so decisions rest on stated assumptions rather than seniority.
- It forces assumptions into the open. Scoring Confidence explicitly makes the team admit what it does and does not know.
- It rewards efficient work. The Effort divisor surfaces quick wins that a value-only method would bury under grander projects.
Where RICE falls short:
- It can create false precision. A score of 812 looks exact, but it is built on estimates, and a confident-looking number can hide a shaky guess.
- It depends on the quality of your inputs. Garbage Reach and Effort figures produce a garbage ranking, which is why Standish also found that even in 2014, roughly 80% of features delivered low to no value despite deliberate planning.
- It underweights hard-to-quantify work. Foundational or strategic bets that resist a clean Reach number can score poorly even when they matter.
The Confidence factor is RICE’s built-in defense against its own weakness, forcing you to discount estimates you cannot back up, an idea that echoes Kahneman’s work on how badly people judge their own certainty. Used with that humility, RICE is a strong aid to judgment rather than a replacement for it.
RICE prioritization works because it makes trade-offs explicit. By scoring Reach, Impact, Confidence, and Effort separately and combining them into one number, it turns a roadmap argument into a comparison you can inspect and defend. It will not tell you the future, and it is only as good as the estimates you put into it, yet even a rough RICE score beats a decision made by whoever argued hardest. Score honestly, discount what you cannot prove, revisit as you learn, and RICE becomes a reliable way to spend your build time where it counts. Start with your current backlog, score the top ten candidates this week, and compare the ranking RICE produces against the order you would have chosen by instinct. Where the two disagree is where the framework is most likely earning its place, because those are the decisions your gut was about to get wrong.
Frequently asked questions
What is RICE prioritization?
RICE prioritization is a scoring framework that ranks product initiatives by four factors: Reach, Impact, Confidence, and Effort. Each initiative gets a score calculated as Reach multiplied by Impact multiplied by Confidence, divided by Effort. Ranking the scores from high to low produces a prioritized backlog that favors high-value, low-effort work. It was created by Sean McBride on the product team at Intercom.
How do you calculate a RICE score?
Multiply the three value factors together and divide by effort: RICE score = (Reach times Impact times Confidence) divided by Effort. Reach is the number of people affected in a period, Impact is a 3 to 0.25 scale, Confidence is a percentage from 100% to 50%, and Effort is estimated in person-months. For example, an initiative reaching 1,500 people at Impact 1 and 100% confidence over 1 person-month scores 1,500.
What is a good RICE score?
There is no universal threshold, because RICE scores are only meaningful relative to each other within your own backlog. A score of 800 is high in a list where most items score under 300 and unremarkable in a list where several exceed 2,000. Use RICE to rank initiatives against one another rather than to judge any single score in isolation, and re-run the comparison whenever the inputs change.
RICE vs ICE, which is better?
It depends on the stage and the stakes. ICE is faster because it scores only Impact, Confidence, and Ease with no effort divisor, which suits quick early triage. RICE is more rigorous because it adds Reach and divides by Effort, which makes it more defensible for a shared roadmap where you need to justify the order to stakeholders. Use ICE for speed and RICE when the decision needs to hold up to scrutiny.
Who invented the RICE framework?
RICE was created by Sean McBride while he was on the product team at Intercom. He designed it to compare very different roadmap ideas on a consistent basis, so the team could prioritize without the loudest advocate automatically winning. The framework has since been adopted widely across product management and built into several road mapping tools.