Every customer service metric worth tracking, with the formula, a worked example, a 2026 benchmark, and the counter-metric that stops it from being gamed.
The customer service metrics that matter are divided into four groups. Speed metrics such as First Response Time and Average Handle Time show how fast you answer. Quality metrics such as First Contact Resolution and Reopen Rate show whether the answer worked. Sentiment metrics such as CSAT, CES, and NPS show how it felt. AI metrics such as resolution rate and containment show what automation actually closed. Every one of them needs a counter-metric, because any single number can be hit by damaging another.
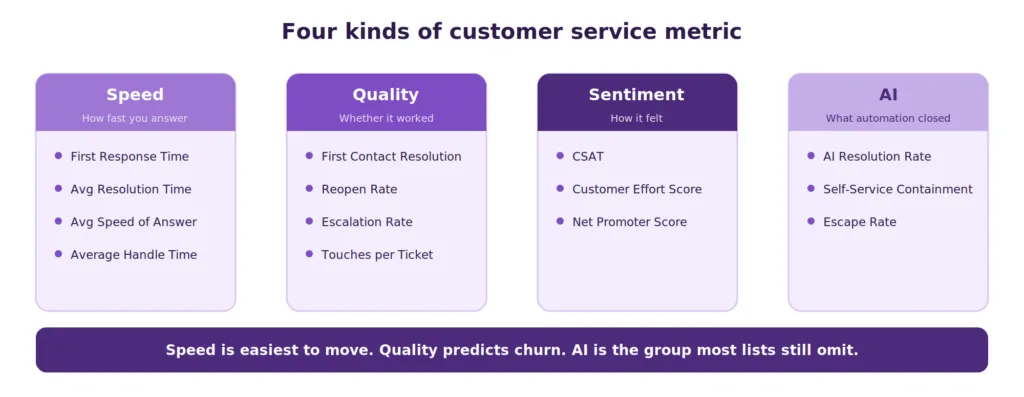
Diagram of the four categories of customer service metrics and what each one answers
What Are Customer Service Metrics?
Customer service metrics, also called customer support metrics, are the measurements that show how well a support team resolves customer problems. They cover how quickly the team responds, whether the response solved the problem, how the customer felt about it, and increasingly what share of the work automation handled.
They differ from customer success metrics, and mixing the two is a common reporting mistake. Support metrics measure the interaction: response time, resolution rate, satisfaction with the answer. Success metrics measure the commercial relationship: net revenue retention, lifetime value, expansion. A support leader needs the first set to run the team and borrows from the second set only when reporting to a board.
The reason to be careful about that boundary is accountability. A support team can be excellent while revenue retention falls for pricing reasons entirely outside its control, and measuring it on the wrong number produces the wrong decisions.
All 15 Metrics With 2026 Benchmarks
Benchmarks reflect published contact center and industry data as of August 2026. Treat them as reference ranges rather than targets, since a fair target depends on your channel mix and issue complexity.
| Metric | Formula | Benchmark | Counter-metric |
|---|---|---|---|
| First Response Time | Total time to first reply / conversations | Under 1 hour email, under 1 min chat | CSAT |
| Average Resolution Time | Total resolution time / resolved tickets | Varies by complexity | Reopen rate |
| Average Speed of Answer | Total wait time/calls answered | Under 28 seconds | Abandonment rate |
| Average Handle Time | Talk + hold + wrap / contacts | 4 to 7 minutes | First Contact Resolution |
| First Contact Resolution | Resolved first contact/total | 70 to 79%, world-class 90% | Reopen rate |
| Reopen Rate | Reopened tickets / resolved tickets | Under 10% | FCR |
| Escalation Rate | Escalated / total tickets | Under 10% | CSAT on escalated |
| Touches per Ticket | Total replies/tickets resolved | 2 to 3 for routine | Resolution time |
| CSAT | Positive responses / total responses | 85% or higher | Response rate |
| Customer Effort Score | Sum of scores/responses | Lower effort is better | CSAT |
| Net Promoter Score | Promoters % minus detractors % | Varies widely by sector | Segment coverage |
| Ticket Volume | Total tickets in period | Track trend, not level | Volume per customer |
| Backlog and Ticket Age | Open tickets by age band | Under 5% over 7 days | Resolution time |
| AI Resolution Rate | AI-closed / total conversations | Audit before trusting | Escalation-after-AI |
| Self-Service Containment | Contained / self-service sessions | Track with escape rate | Escape rate |
Two things to notice. Every metric has a counter-metric, and no metric in this list is a revenue metric. Both are deliberate.
Speed Metrics
These measure how fast you get to the customer. They are the easiest to improve and the easiest to improve destructively.
1. First Response Time
Formula: total time to first human reply divided by number of conversations.
Worked example: a team receives 200 tickets in a week and takes 12,000 minutes in total to send first replies. FRT is 12,000 divided by 200, or 60 minutes.
Benchmark: under an hour for email, under a minute for live chat. Customers judge this against the channel they chose rather than against your internal average.
What it does not tell you: whether the reply helped. An automated acknowledgment improves FRT and helps nobody, which is why teams that chase this number in isolation see satisfaction stay flat while the metric improves.
Counter-metric: CSAT. If FRT falls while CSAT stays still, you are answering faster without answering better.
2. Average Resolution Time
Formula: total time from ticket creation to resolution, divided by tickets resolved.
Worked example: 150 tickets resolved over a month with a combined resolution time of 900 hours gives an ART of six hours.
Benchmark: varies too much by issue type for a single number to be useful. Segment by category and set targets per category instead. There is fuller detail in this guide to time to resolution.
What it does not tell you: whether the resolution held. Closing tickets quickly inflates this number and creates tomorrow’s reopens.
Counter-metric: reopen rate.
3. Average Speed of Answer
Formula: total queue wait time divided by calls answered.
Worked example: 500 calls answered with 12,500 seconds of combined wait time gives an ASA of 25 seconds.
Benchmark: under 28 seconds, with the long-standing service level standard answering 80% of calls within 20 seconds.
What it does not tell you: what happened to the people who hung up. ASA only counts answered calls, so a queue that sheds its longest waiters looks better than it is.
Counter-metric: abandonment rate, which is where the missing callers appear.
4. Average Handle Time
Formula: talk time plus hold time plus after-call work, divided by contacts handled.
Worked example: an agent spends 300 minutes of talk time, 40 minutes on hold, and 60 minutes on wrap across 80 contacts. AHT is 400 divided by 80, or five minutes.
Benchmark: four to seven minutes for general service, legitimately longer for technical issues.
What it does not tell you: almost anything on its own. This is the most misused metric in support. Setting it as a target teaches agents to close early, which lowers FCR and raises repeat contacts, and total cost rises while the metric improves. Read it as a diagnostic that explains staffing cost. There is more in this guide to average handle time.
Counter-metric: First Contact Resolution, always.
Resolution Quality Metrics
These measure whether the answer worked. They predict churn better than speed metrics and get less attention than they deserve.
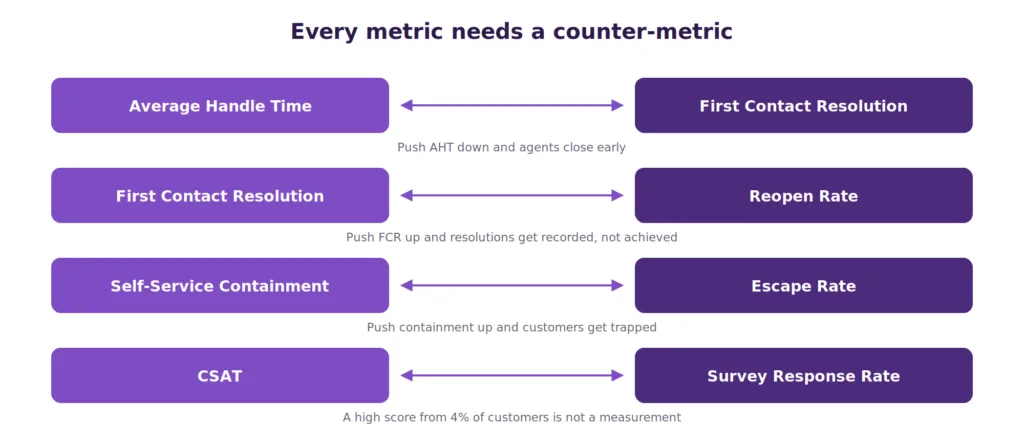
Diagram showing how support metrics pair with counter-metrics to prevent gaming
5. First Contact Resolution
Formula: issues resolved on the first contact divided by total issues.
Worked example: 340 of 425 tickets resolved without a follow-up gives an FCR of 80%.
Benchmark: 70 to 79% is the industry range, with world-class operations reaching 90%.
What it does not tell you: whether agents recorded resolution or achieved it. FCR is self-reported in most systems, which makes it inflatable. Details on improving it are in this guide to first call resolution.
Counter-metric: reopen rate, which is the honest check on the same claim.
6. Reopen Rate
Formula: tickets reopened after being marked resolved, divided by tickets resolved.
Worked example: 28 reopens against 400 resolved tickets gives a reopen rate of 7%.
Benchmark: under 10%. Sustained readings above 15% usually indicate resolutions being recorded rather than achieved.
What it does not tell you: whether the customer gave up instead of reopening. Some frustrated customers churn rather than come back, so a low reopen rate paired with falling CSAT is a warning rather than a success.
Counter-metric: FCR, read as a pair.
7. Escalation Rate
Formula: tickets escalated to a higher tier or specialist, divided by total tickets.
Worked example: 45 escalations from 600 tickets gives an escalation rate of 7.5%.
Benchmark: under 10% for most operations.
What it does not tell you: whether escalation was correct. Some issues should escalate immediately, and a team that escalates too little is holding onto problems it cannot solve, which damages resolution time and effort at once.
Counter-metric: CSAT on escalated tickets specifically.
8. Touches per Ticket
Formula: total replies divided by tickets resolved.
Worked example: 1,200 replies across 400 resolved tickets gives three touches per ticket.
Benchmark: two to three for routine issues.
What it does not tell you: whether the extra touches were the agent’s fault. High touches usually mean the first reply asked for information the form should have collected, which makes this a diagnostic for your intake process rather than for agent skill.
Counter-metric: resolution time.
Satisfaction and Effort Metrics
These measure how the interaction felt. They are the numbers most likely to reach an executive dashboard, and the most frequently misread.
9. Customer Satisfaction Score
Formula: positive responses divided by total responses, as a percentage.
Worked example: 340 positive ratings from 400 survey responses gives a CSAT of 85%.
Benchmark: 85% or higher is a common operational target.
What it does not tell you: what your customers think. It tells you what the customers who answered think, and people who felt strongly answer more often. Always publish the response rate alongside the score.
Counter-metric: survey response rate.
10. Customer Effort Score
Formula: average of all effort ratings on your chosen scale.
Worked example: 500 responses summing to 1,750 points on a seven-point scale gives a CES of 3.5.
Benchmark: track your own trend rather than a cross-industry number, since scales differ.
Why it matters more than CSAT: Gartner found that 96% of customers who had a high-effort experience became disloyal, against 9% of those with a low-effort experience. Effort predicts churn better than satisfaction does.
Counter-metric: CSAT, since easy and unsatisfying is a real combination.
11. Net Promoter Score
Formula: percentage of promoters scoring 9 to 10, minus percentage of detractors scoring 0 to 6.
Worked example: 300 responses with 150 promoters and 60 detractors gives 50% minus 20%, an NPS of 30.
Benchmark: varies enormously by sector, so compare against your own industry rather than a general average.
What it does not tell you: anything about a specific interaction. NPS measures the relationship, which means a support team can be excellent while NPS falls for pricing or product reasons. Segment it by account tier before acting on it.
Counter-metric: segment coverage, so you know which parts of the base actually responded.
Volume and Capacity Metrics
12. Ticket Volume
Formula: total tickets received in a period.
The level tells you nothing without context, because volume rises with customer count. Track tickets per hundred customers instead, which is the number that shows whether your product and documentation are getting better or worse.
Counter-metric: volume per customer rather than absolute volume.
13. Backlog and Ticket Age
Formula: open tickets grouped into age bands.
Worked example: 500 open tickets, of which 22 are older than seven days, gives 4.4% in the oldest band.
Benchmark: under 5% older than seven days for most operations.
Why age beats count: a backlog of 500 fresh tickets is a staffing question. A backlog of 50 tickets averaging three weeks old is a customer relationship problem, and the raw count treats them identically.
Counter-metric: resolution time.
AI and Automation Metrics
This group is missing from most published metric lists because those lists predate autonomous AI agents. Salesforce reports that 66% of service organizations were running AI agents in 2026, up from 39% the year before, which makes these measurements standard rather than advanced.
14. AI Resolution Rate
Formula: conversations closed by AI without human involvement, divided by total conversations.
Worked example: 1,200 of 4,000 conversations closed by AI gives a resolution rate of 30%.
The distinction that matters: deflection and resolution are different things, and vendors frequently blur them. Deflection counts conversations that never reached an agent, including customers who gave up. Resolution counts problems actually solved. Gartner data shows AI deflecting more than 45% of queries while only around 14% of issues reach full self-service resolution, and that 30-point gap is where the difference lives.
Counter-metric: escalation-after-AI rate, meaning conversations the AI closed that came back as a new ticket within seven days.
15. Self-Service Containment Rate
Formula: sessions resolved without an agent, divided by total self-service sessions.
Worked example: 700 of 1,000 help center sessions ending without a ticket gives 70% containment.
What it does not tell you: whether the customer was helped or trapped. A high containment number can mean either, which is why it should never be reported alone.
Counter-metric: escape rate, meaning sessions that ended without resolution and without reaching a human.
The dependency behind both: Gartner’s 2025 AI Implementation Survey found that 62% of underperforming AI customer service projects trace to data preparation rather than model limitations. AI metrics measure your knowledge base as much as your model, which is why a knowledge base audit usually precedes any improvement in these numbers.
Every Metric Needs a Counter-Metric
This is the single most useful principle in support reporting, and it appears in almost no published metric guide.
Any individual metric can be hit by damaging something else. Push AHT down and agents close early, so FCR falls. Push FCR up and agents record resolutions they did not achieve, so reopens rise. Push containment up, and customers get trapped in self-service, so effort rises, and they arrive angrier.
Pairing prevents this, because improving one number at the other’s expense shows up immediately in the pair. The practical rule is that no metric goes on a dashboard alone, and no target is set on a metric without its counter-metric being reported beside it.
The four pairs worth building a dashboard around are AHT with FCR, FCR with reopen rate, containment with escape rate, and CSAT with response rate. Those four cover most of the ways support reporting misleads.
Which Customer Service Metrics to Track at Your Stage
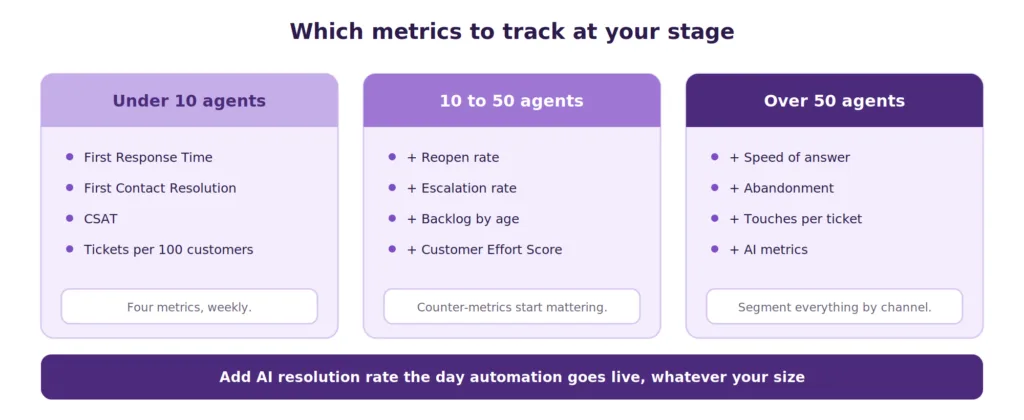
Diagram of which support metrics to track at three team sizes
Under 10 agents. First Response Time, First Contact Resolution, CSAT, and ticket volume per customer. Four metrics, reviewed weekly. Anything more produces reporting overhead that a small team pays for in time it does not have.
10 to 50 agents. Add reopen rate, escalation rate, backlog by age, and CES. This is where counter-metric discipline starts mattering, because targets are now being set and gaming becomes possible.
Over 50 agents. Add speed of answer, abandonment, touches per ticket, and the AI metrics if automation is running. Segment everything by channel and issue type, because blended numbers at this scale hide more than they show.
When AI is deployed at any size. Add AI resolution rate and containment immediately, with their counter-metrics. Deploying automation without measuring resolution means discovering at renewal that you cannot prove what it did.
Five Mistakes That Make Metrics Useless
Setting AHT as a target. The most common self-inflicted wound in support management. It reliably improves the metric and worsens the operation.
Blending issue types. A single FCR figure across billing, technical, and account questions is close to meaningless, since each resolves differently.
Reporting CSAT without response rate. A score built on 4% of customers is a measurement of strong feelings rather than of service quality.
Confusing deflection with resolution. Deflection counts avoidance. Resolution counts solutions. Only one of them is worth paying for.
Tracking success metrics on a support dashboard. Net revenue retention and lifetime value are real numbers that support does not control. Measuring a support team on them produces the wrong decisions, and they belong on a different dashboard.
Where Kayako Fits
Kayako reports on resolution rather than volume, which is the distinction most of these metrics depend on.
Agent Kay resolves routine questions directly from your knowledge base and reports what it actually closed rather than what it merely entered, so AI resolution rate and containment come with the counter-metrics attached. SingleView keeps full customer history on one record, which lowers touches per ticket and effort at the same time. Billing is per resolved ticket rather than per seat, so the metric you are trying to improve and the metric you are billed on are the same one.
Trilogy provides the clearest example. After moving to Kayako, the team removed 80% of ticket volume, reached 76% autonomous resolution, and cut ticket age from 17.6 hours to under two minutes during a 90-day rollout.
Customer service metrics divide into speed, quality, sentiment, and automation, and most teams over-invest in the first group because it is easiest to move. Quality metrics predict churn better, sentiment metrics explain it, and the AI group has become standard fast enough that most published metric lists have not caught up.
The principle that matters more than the metric selection is pairing. Every number on a support dashboard should have a counter-metric beside it, because any single figure can be hit by damaging another. AHT with FCR, FCR with reopen rate, containment with escape rate, CSAT with response rate.
Start by segmenting First Contact Resolution by issue type this month, and putting reopen rate next to it. That one change reveals more about where your support operation actually stands than adding any new metric would.
Frequently Asked Questions
What are the most important customer service metrics?
First Contact Resolution, Customer Effort Score, and reopen rate predict churn most reliably. First Response Time and CSAT are the most commonly reported. If you track only four, use FRT, FCR, CSAT, and tickets per hundred customers.
What is the difference between customer service metrics and customer success metrics?
Support metrics measure the interaction: response time, resolution rate, satisfaction with the answer. Success metrics measure the commercial relationship: net revenue retention, lifetime value, expansion. Support teams should be measured on the first set, since they do not control pricing or product.
What is a good first response time?
Under an hour for email and under a minute for live chat are common targets. Customers judge response time against the channel they chose, so a single blended target across channels tends to satisfy nobody.
What is a good first contact resolution rate?
Published contact center benchmarks put the range at 70 to 79%, with world-class operations reaching 90%. Segment by issue type, since billing and technical questions resolve at very different rates.
Why should I not set average handle time as a target?
Because agents hit it by closing conversations early. FCR falls, reopens rise, and total cost increases while the metric improves. Use AHT as a diagnostic for staffing cost and let resolution govern targets.
What is the difference between deflection and resolution?
Deflection counts conversations that never reached an agent, including customers who gave up. Resolution counts problems actually solved. Industry data shows AI deflecting over 45% of queries while only around 14% reach full self-service resolution, so the two numbers are not interchangeable.
How many customer service metrics should I track?
Four under ten agents, around eight between ten and fifty, and twelve or more above that, with everything segmented by channel and issue type. More metrics than your team can act on weekly is reporting overhead rather than insight.
What is a counter-metric?
A second measurement that reveals whether the first was improved honestly. AHT pairs with FCR, FCR with reopen rate, containment with escape rate, and CSAT with response rate. No metric should go on a dashboard without one.
How do I measure AI performance in customer support?
Track AI resolution rate, meaning conversations closed without a human, alongside escalation-after-AI, meaning conversations the AI closed that returned within seven days. Containment should always be paired with escape rate. Deflection alone is not a measure of success.
How often should support metrics be reviewed?
Queue metrics such as speed of answer and abandonment need daily review. Resolution and quality metrics suit a weekly cadence. Satisfaction and trend metrics belong in monthly reporting.