Kayako One Logo Kayako One Logo
Uncategorized

A Complete Guide to Customer Satisfaction Score (CSAT)

Every customer interaction is a moment of truth. A purchase completed, a support ticket resolved, a product returned, each one leaves a customer with a feeling. The question is whether you are measuring it.

96% of unhappy customers never complain; they’ll simply leave. Customer Satisfaction Score (CSAT) is the metric that closes that gap: a simple, fast-moving signal that tells you whether each interaction is building loyalty or quietly eroding it.

This guide covers everything you need: the full form, the formula, industry benchmarks, collection methods, how CSAT fits alongside NPS and CES, how to improve your score, the tools that automate it, and the case studies that prove what is possible.

What Is CSAT Score? Definition and Full Form

CSAT stands for Customer Satisfaction Score. It is a transactional customer experience metric that measures how satisfied a customer was with a specific interaction, product, or service, typically captured through a one-question survey rated on a 1-to-5 or 1-to-10 scale immediately after an experience.

The standard CSAT question is: “How satisfied were you with your experience today?” Customers respond using a rating scale, where the highest scores (4 and 5 on a 1-to-5 scale) are classified as satisfied responses and used to calculate the final percentage.

what is csat score?

CSAT sits at the fast-feedback end of the CX metrics spectrum. Unlike Net Promoter Score, which measures long-term loyalty and referral likelihood, or Customer Effort Score, which measures friction, CSAT captures immediate, interaction-level satisfaction. It is most valuable when deployed at high-frequency touchpoints where satisfaction can vary significantly: post-purchase, post-support, post-onboarding.

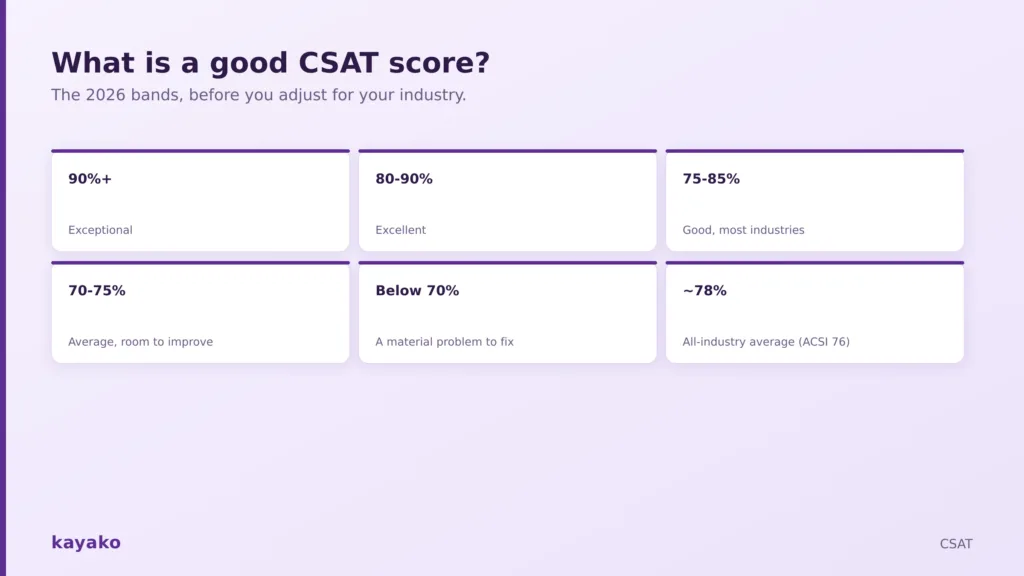
The average CSAT score across all industries is 78% (Salesforce, cited in Sobot, 2025). That benchmark is a useful calibration point, but as this guide will show, industry context changes what a good score actually looks like.

How to Calculate CSAT Score

The standard formula

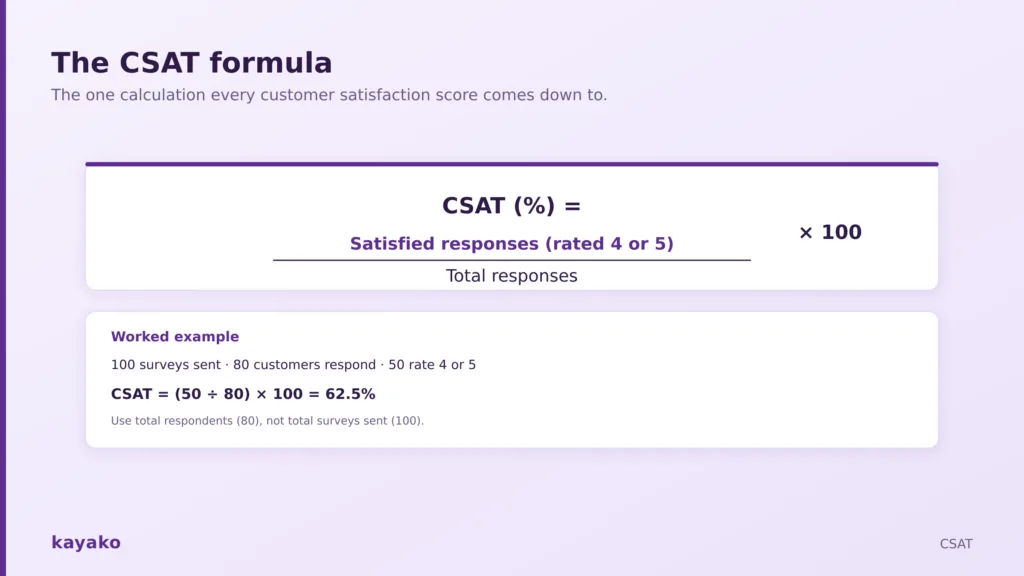
CSAT (%) = (Number of satisfied responses / Total number of responses) x 100

On a 1-to-5 scale, satisfied responses are scores of 4 or 5. On a 1-to-10 scale, satisfied responses are typically 7 to 10, depending on the convention used by the organization.

Worked example
You send 100 post-support surveys.
80 customers respond.
Of those 80 responses, 50 score 4 or 5.

CSAT = (50 / 80) x 100 = 62.5%

Note: the calculation uses total respondents (80), not total surveys sent (100).
This matters — your response rate affects the representativeness of your score, not the formula itself.

The 1-to-10 variant

Some platforms use a 1-to-10 scale. In this case, satisfied responses are typically 7 to 10. The formula is identical: satisfied respondents divided by total respondents, multiplied by 100. The key is consistency: once you choose a scale, use it everywhere so trend data is comparable over time.

The composite (average) variant

Some teams calculate a composite score by averaging all numerical ratings rather than applying a threshold. This produces a score expressed as a decimal (e.g., 4.2 out of 5) rather than a percentage. The percentage method is more common and directly comparable to industry benchmarks. Both are valid; choose one and standardize it.

For a fast calculation, use Kayako’s CSAT calculator to get your score immediately from raw response data.

What Is a Good CSAT Score? Benchmarks by Industry

A good CSAT score in 2026 generally falls between 75% and 85%. Scores above 90% are considered exceptional (SurveySparrow, 2025). Below 70% signals that customer experience improvement is a material business priority.

The critical point: industry context changes everything. A score of 75% is strong in banking but lags in consulting. Always benchmark against your sector, not the overall average.

Sources: QuestionPro CSAT Benchmarks 2025, Fullview.io Industry Benchmarks, SurveySparrow 2025, ACSI 2024-2025

what is a good csat score

How to Collect CSAT Data

The timing and channel of your CSAT survey shape the quality of the data you get back. The closer the survey is to the actual experience, the more accurate the response.

Post-interaction and post-ticket surveys

The most common CSAT collection method in customer service. A survey is triggered automatically when a support ticket closes or a chat session ends. This captures satisfaction while the experience is fresh, and allows the response to be linked directly to the ticket, the agent, and the issue category. Most helpdesk platforms support this as a native feature.

Transactional email surveys

Sent within minutes or hours of a specific transaction, such as a purchase confirmation, a shipment update, or an account change. Email CSAT works well for e-commerce and subscription businesses where key touchpoints have natural email triggers. Keep the survey to one or two questions embedded in the email body; surveys that require clicking through to a form see significantly lower response rates.

In-app prompts

Triggered within the product after a feature is used, a milestone is reached, or a session ends. Best suited for SaaS products where usage patterns are trackable. In-app CSAT captures feedback from active users at the moment of engagement, but should be timed carefully to avoid interrupting tasks in progress.

SMS and text surveys

High open rates (85% or above for SMS) make this channel effective for mobile-first audiences and post-service field interactions. Text CSAT is particularly effective in healthcare, logistics, and field service contexts where the interaction has just concluded in the physical world, but the customer is on a mobile device.

IVR and post-call surveys

Automated voice surveys are delivered at the end of a phone call via IVR. The customer rates the call by pressing a keypad number. Response rates are lower than digital surveys, but post-call CSAT is one of the few methods that reaches customers who prefer phone over digital channels, a population that is often underrepresented in CSAT data.

Related Reads for you  What is Average Handle Time (AHT): Formula, Benchmarks & How to Improve It

In-store and in-person surveys

Tablet-based prompts at checkout, exit kiosks, or on printed receipts via QR code. These capture immediate sentiment in physical retail, hospitality, and healthcare settings. The main limitation is social desirability bias: customers rating the experience while staff are visible tend to score higher than they would anonymously.

Kayako connects post-ticket CSAT data to individual agent records — so coaching happens on real interactions, not averages. See How It Works

How CSAT Works in Customer Service

In a support context, CSAT is not just a company-level metric; it is an agent-level tool and a team management lever.

Agent-level CSAT

When CSAT is tied to individual tickets, you can track satisfaction by agent. An agent consistently scoring below the team average on a specific issue type has a diagnosable gap: knowledge, tone, resolution authority, or routing. An agent scoring above average on the same issue type has a transferable practice worth studying. Agent-level CSAT turns a lagging metric into a coaching tool.

CSAT and SLA alignment

Response time and resolution speed are among the strongest drivers of CSAT in support contexts. Companies using AI in customer service see CSAT scores increase by 65% on average (SurveySparrow, 2025), largely because AI-assisted interactions reduce wait times and first-contact resolution time. Setting SLAs that reflect what customers actually experience as fast is more effective than setting them based on operational convenience. See how SLAs map to customer satisfaction outcomes for a framework.

First contact resolution as a CSAT lever

The single most consistent driver of CSAT in support operations is whether the issue was resolved on the first contact. First contact resolution reduces the effort customers have to exert, eliminates the frustration of follow-up contacts, and directly predicts CSAT outcomes. Teams that prioritize FCR improvement see CSAT lift before they change anything else about their support process.

Self-service and CSAT

Customers who resolve their issues through self-service channels often report higher satisfaction than those who needed agent assistance because they resolved the issue faster and on their own schedule. A well-designed self-service portal deflects routine volume and simultaneously lifts CSAT by serving customers the way they prefer to be served.

CSAT vs. NPS vs. CES — When to Use Which

CSAT NPS CES
What it measures Satisfaction with a specific interaction Overall loyalty and referral likelihood How easy it was to get help
Question asked “How satisfied were you?” “How likely to recommend us?” “How easy was it to resolve?”
Scale 1-5 or 1-10 0-10 1-5 or 1-7
Best used After specific touchpoints Periodic relationship check-in After support or task completion
Frequency High (every interaction) Low (quarterly or annual) Medium (post-service)
Limitation No long-term loyalty signal No interaction-level detail Does not capture satisfaction tone


The decision rule: use CSAT when you need to know whether a specific experience landed well. Use NPS when you need to understand overall brand loyalty and growth trajectory. Use CES when you want to know how much effort a customer had to exert, which is often the clearest predictor of customer effort and churn risk. All three together give you the full picture.

The Benefits of Measuring CSAT

  • Fast feedback signal. CSAT data flows in at the speed of interactions. Unlike quarterly NPS surveys, CSAT gives you a rolling view of satisfaction that surfaces problems before they compound into churn.
  • Agent coaching precision. Ticket-level CSAT tells you which agents need support and on which issue types. It converts a lagging metric into a specific, actionable coaching input.
  • Churn prediction. Customers scoring 1 or 2 on a CSAT survey are statistically more likely to churn than those scoring 4 or 5. Tracking low-CSAT customers and triggering follow-up reduces involuntary churn from solvable problems.
  • Product feedback loop. Categorizing the open-ended CSAT follow-up (“What could we have done better?”) by product area reveals the specific features, friction points, and missing capabilities that drive satisfaction or dissatisfaction — without running a separate research project.
  • Executive and investor reporting. A trending CSAT score is a credible proxy for customer health that non-technical executives can track alongside revenue and retention. McKinsey’s research identifies consistency, across channels and over time, as the primary driver of customer satisfaction — and CSAT is the metric that surfaces inconsistency fastest (McKinsey, The Three Cs of Customer Satisfaction).

The Challenges of CSAT and Its Limitations

Survey fatigue reduces response quality

Customers who are surveyed too frequently begin to either ignore requests or give rapid, unconsidered ratings. Response rates drop, and the ratings that do arrive reflect irritation with the survey process rather than the experience itself. A consistent survey cadence with clear trigger rules — one survey per interaction type per customer, per a defined period — is the structural fix.

Response bias skews the sample

The customers most likely to respond to a CSAT survey are those with strong feelings: very satisfied or very frustrated. The silent middle, where customers who felt nothing particularly good or bad tend not to respond. This creates a bimodal distribution that overstates the extremes and understates the typical experience.

Recency bias captures the wrong moment

A customer who had an excellent product experience but then waited 20 minutes to reach support will rate the support interaction, not the product. CSAT captures the last moment before the survey, not the sum of the relationship. This is a feature when used correctly (measuring the specific touchpoint) and a bug when the survey timing is misaligned with what you intended to measure.

Related Reads for you  What Is Live Chat? Benefits, Best Practices, and AI Impact [2026]

Cultural differences affect scores

North American customers tend to rate experiences more positively than European customers for identical service levels. Customers in some markets default to 3 on a 5-point scale as a neutral “fine” response rather than a signal of mediocrity. Global businesses need region-specific benchmarks rather than universal targets, and should interpret cross-region comparisons with caution.

The metric captures satisfaction, not loyalty

A high CSAT score means the customer was satisfied with that interaction. It does not mean they will return, refer others, or remain customers long-term. CSAT is a leading indicator of retention, not a guarantee of it. Pairing it with NPS at the relationship level and CES at the effort level gives you a more complete picture of the customer’s future behavior.

How to Improve Your CSAT Score

Reduce response time above all else

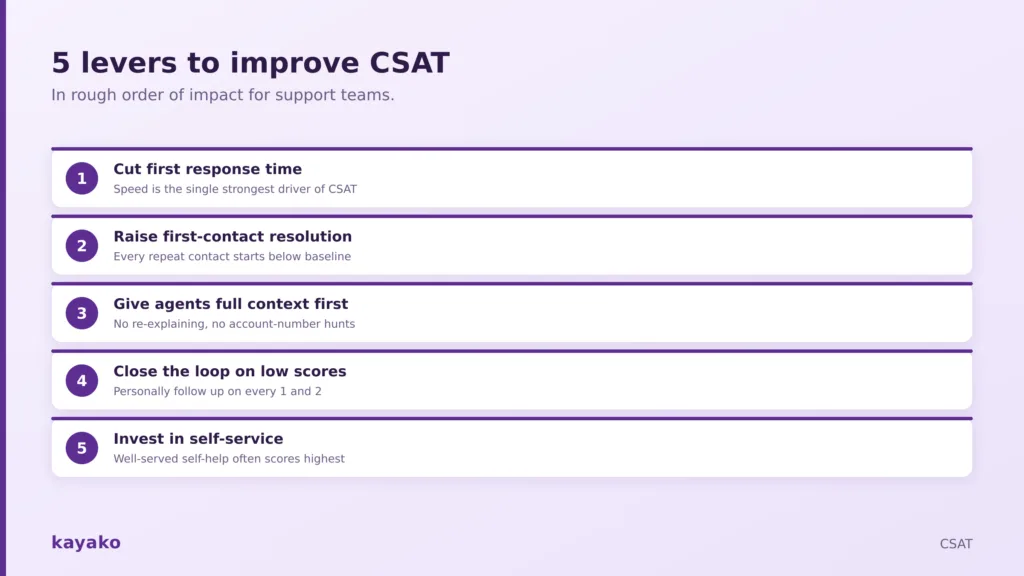
Speed is the most consistent driver of CSAT across all support channels. Customers do not expect perfection; they expect a fast acknowledgment and a clear timeline. Setting and hitting response time SLAs is the fastest way to lift CSAT without changing anything about the resolution quality.

Increase first contact resolution

Every time a customer has to contact you twice for the same issue, their CSAT for the second interaction starts below baseline. First contact resolution improvement through better knowledge base access, agent training, and routing accuracy lifts CSAT structurally because it removes the primary source of repeat frustration.

Give agents the customer context before they respond

An agent who has to ask for an account number, a previous ticket reference, or a description of what the customer already tried is starting the interaction with negative momentum. Unified customer history visible before the agent types a word turns those first exchanges from friction into trust. Kayako’s Trilogy customer reduced average ticket age from 18 hours to under 5 after implementing this approach, resulting in CSAT moving from 76% to 90%.

Close the feedback loop on low CSAT responses

A customer who scores 1 or 2 and receives no follow-up will almost certainly churn. A customer who scores 1 or 2 and receives a personal response that acknowledges what went wrong and confirms it has been addressed may stay, and is very likely to remember the recovery more clearly than the original failure. Automated routing of low-CSAT tickets to team leads for personal follow-up is a high-leverage, low-cost CSAT improvement mechanism.

Invest in self-service quality

Customers who resolve issues through a well-designed knowledge base or self-service portal often report higher satisfaction than those who need an agent. Knowledge base best practices that keep content accurate, searchable, and structured for scannability produce self-service CSAT improvements that compound over time as coverage grows.

See how Kayako connects CSAT data, ticket records, and agent history into one view — for coaching that lands. Book a Demo

How to Set Up an Effective CSAT Survey

Keep it to one or two questions

The standard CSAT survey has one question: the rating. Adding a follow-up (“What could we have done better?” or “What did we do well?”) adds meaningful context without significantly reducing completion rates. Every question added beyond two reduces response rates and dilutes the signal.

Use clear, simple language

The question should ask about the specific thing you want to measure: “How satisfied were you with the support you received today?” not “How would you rate your overall experience with our company?” Specific questions produce specific, actionable data. Vague questions produce vague scores that are hard to act on.

Time the survey correctly

Send the survey immediately after the interaction closes, within minutes for digital channels, within hours for phone. Satisfaction memory degrades quickly. A survey sent 48 hours after a support ticket closes is measuring the customer’s general feeling about the company as much as their recollection of that specific interaction.

Design for mobile first

More than half of survey responses now come from mobile devices. A five-star rating that requires precise tapping on a small screen, or a text field that is hard to type in on a phone, will reduce response rates and depress scores. Star ratings, emoji scales, and single-tap options perform better on mobile than number grids or slider controls.

Avoid survey fatigue through trigger logic

Define rules that prevent the same customer from receiving multiple CSAT requests within a defined window. One survey per customer per interaction type per 30 days is a reasonable starting threshold. This protects response quality and prevents the survey itself from becoming a negative experience.

csat playbook

Best CSAT Software and Tools in 2026

These platforms cover collection, analysis, integration, and closed-loop follow-up across the full CSAT workflow.

1. Qualtrics

Best for: Enterprise experience management. Advanced analytics, driver analysis, and integration with operational and HR data alongside CSAT. The most capable platform for large-scale CX programs.

2. Medallia

Best for: Real-time experience management in financial services, retail, and hospitality. Strong at connecting CSAT data to operational decisions at the individual location or interaction level.

Related Reads for you  What Is B2B Customer Service? Definition, Best Practices, and Examples [2026]

3. SurveyMonkey (Momentive)

Best for: Teams wanting CSAT integrated into a broader survey and research platform. Strong panel access for external benchmarking alongside internal measurement.

4. Hotjar

Best for: Product and UX teams. Connects CSAT surveys to session recordings and heatmaps, so satisfaction data is paired with behavioral data for richer diagnosis.

5. Survicate

Best for: Multi-channel CSAT collection with strong integrations to Intercom, HubSpot, and Slack. Good balance of features and price for mid-market teams.

6. Delighted

Best for: Fast deployment. Clean interface, multi-channel distribution, and dashboards that surface trends without requiring analyst support. One of the fastest platforms to get live.

7. Typeform

Best for: Teams prioritizing survey completion rates. Conversational format typically outperforms traditional survey layouts on mobile, which matters when sample size is a constraint.

8. Zendesk CSAT

Best for: Teams already running Zendesk for support. Native post-ticket CSAT is built into the workflow, with agent-level reporting and SLA correlation out of the box.

9. Userpilot

Best for: SaaS product teams. In-app CSAT triggered at product milestones, combined with product analytics and user segmentation for targeted follow-up.

10. Kayako

Best for: Support teams wanting CSAT tightly integrated with ticketing, agent history, and customer context. Post-ticket CSAT flows directly into agent performance reporting, SLA tracking, and the unified customer support platform view. Outcome-based pricing at $1 per resolved ticket.

Real-World CSAT Examples and Case Studies

Samsung: 97% CSAT through AI-powered support

Sobot helped Samsung reach a 97% customer satisfaction score by deploying AI-powered support that reduced handle time and improved first-contact resolution across channels (Sobot, 2025). The result demonstrates what is possible when AI is applied to routine volume, freeing human agents for complex interactions that require judgment and empathy.

Kayako customer: Trilogy

Trilogy CSAT improvement
Before Kayako: Average ticket age 18 hours. CSAT: 76%.
Change: Unified customer view, AI triage, automated workflows.
After: Average ticket age under 5 hours. 68% of tickets auto-resolved. CSAT: 90%.
“We weren’t buying a new interface. We were buying a cost reset.” — Colin Guilfoyle, SVP Customer Support

Taylor and Hart: doubling revenue through CSAT tracking

The London-based custom jeweler embedded CSAT tracking at every stage of the customer journey, from consultation through delivery. Acting on low-score feedback to refine their design consultation process, they doubled revenue within two years. The CSAT data did not predict the revenue outcome directly — the operational changes it triggered did.

Keeping a finger on how a customer is reacting is essential to know whether your business is on the right path or not. From gauging the impact of your products to on-ground services, a well-timed survey or a feedback form can help you design the best product portfolio in the time ahead, and this is where a CSAT practice comes to the fore. For everything else in customer service, there’s Kayako, which is the ultimate solution for all your CRM queries and services. 

FAQs

What is the full form of CSAT?

CSAT stands for Customer Satisfaction Score. It is a transactional customer experience metric that measures how satisfied a customer was with a specific interaction, product, or service, typically captured immediately after the experience through a brief one-question survey.

What does CSAT mean in customer service?

In customer service, CSAT is the metric that tells you whether individual support interactions are satisfying customers. It is typically measured via a post-ticket survey rating satisfaction on a 1-to-5 scale. When tracked at the agent level, it becomes a coaching tool. When tracked over time, it is a leading indicator of retention and churn risk.

What is the CSAT score formula, and how do you calculate it out of 5?

CSAT (%) = (Number of satisfied responses / Total number of responses) x 100. On a 1-to-5 scale, “satisfied responses” are ratings of 4 or 5. Example: 50 satisfied responses out of 80 total respondents give a CSAT of 62.5%. Use Kayako’s CSAT calculator to work through your numbers instantly.

What is a good CSAT score?

A good CSAT score in 2025 generally falls between 75% and 85%. Scores above 90% are exceptional. The right benchmark depends entirely on your industry: consulting averages 84%, hospitality 82%, e-commerce 80 to 82%, banking 75 to 85%, and telecom as low as 68%. Always benchmark against your sector rather than the overall average.

Is CSAT or NPS better?

Neither is universally better — they measure different things at different timescales. CSAT measures satisfaction with a specific interaction and is most useful at high-frequency touchpoints. NPS measures overall loyalty and referral likelihood and is most useful for tracking the long-term health of the customer relationship. Teams that use both together get interaction-level detail from CSAT and relationship-level context from NPS. See the full comparison in the CSAT vs. NPS vs. CES section of this guide.

How do I improve a low CSAT score?

The five highest-leverage improvements, in order of typical impact: (1) reduce first response time by setting and hitting SLA targets; (2) improve first contact resolution through better routing, training, and knowledge base access; (3) give agents customer context before they respond, not after the customer re-explains; (4) close the feedback loop personally on all scores of 1 or 2; and (5) invest in self-service quality so customers can resolve routine issues without waiting for an agent.

See Kayako in Action

Ready to transform your customer support with AI?

Join hundreds of support teams using Kayako to resolve tickets faster, raise CSAT, and scale without scaling headcount.

Get customer service insights in your inbox

Expert strategies, product updates, and AI tips — delivered weekly.

Talk to an Expert