A plain definition of customer satisfaction, the three ways it is measured, the academic models that explain it, and current ACSI benchmark scores for fourteen industries.
Customer satisfaction is the extent to which a product, service, or experience meets the expectations a customer brought to it. It is measured most directly through CSAT, a survey asking how satisfied someone was with a specific interaction, and benchmarked nationally through the American Customer Satisfaction Index. The US national ACSI score sits at 76.7 as of Q1 2026, which is where it stood in 2013.
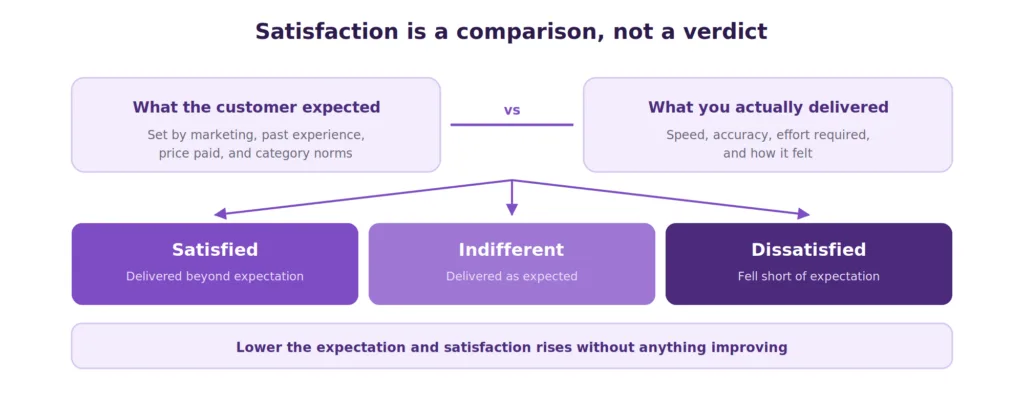
Diagram showing customer satisfaction as the gap between expectation and delivered experience
What Is Customer Satisfaction?
Customer satisfaction is the extent to which a product, service, or overall experience meets the expectations a customer had before the interaction began. It is a comparison rather than an absolute judgment, which is why the same service can satisfy one person and disappoint another.
That comparison structure explains most of what seems puzzling about satisfaction. A budget airline arriving on time satisfies. A premium airline arriving on time is merely expected. Neither delivered better service than the other, and only one earned credit for it, because expectation is the yardstick rather than quality itself.
Three consequences follow, and they shape everything else on this page. Satisfaction can be raised by improving delivery or by managing expectations, which is why over-promising in marketing damages a support team’s scores. Satisfaction is specific to a moment rather than a relationship, so a customer can rate one interaction highly and still leave. And satisfaction is relative to context, so a score means nothing until it is compared against the right industry benchmark.
The 2026 Picture: Thirteen Years Without Movement
The most useful fact about customer satisfaction in 2026 is how little it has changed.
The American Customer Satisfaction Index, run by the University of Michigan’s Ross School of Business since 1994, measures roughly 400 companies across more than 40 industries using around 200,000 interviews a year. In the first quarter of 2026, the national ACSI score fell 0.3% to 76.7, which is the same level it recorded in 2013.
Set that alongside what has been spent. ACSI estimates that investment in improving customer satisfaction and customer experience runs to well over $100 billion annually, with no detectable return, and reports that customer complaints have reached record levels after surging 16% in the first quarter of 2026.
Two readings of that are worth holding at once. The first is that most satisfaction investment has gone into measurement and technology rather than into removing the friction customers actually name. The second is that market concentration has reduced the consequences of dissatisfaction, since a frustrated customer with nowhere better to go stays anyway. ACSI notes that retention has risen even as satisfaction has stalled, which is a warning rather than a comfort. Retention built on a lack of alternatives disappears the moment an alternative arrives.
For a support leader, the practical implication is that benchmark comparison matters more than trend-watching. A flat national number means your industry position is the signal, not your year-on-year movement.
What Is a Good Customer Satisfaction Score?
The honest answer is that it depends entirely on your industry, and the spread is wide enough that the same score can be excellent or poor.
Here are current ACSI scores on the 0 to 100 scale, drawn from ACSI’s own 2026 studies.
| Industry | 2026 ACSI score | Movement |
|---|---|---|
| Full-service restaurants | 82 | Unchanged, among the highest measured |
| Regional and community banks | 83 | Stable |
| Audio streaming | 80 | New entrant, highest in entertainment |
| Banks overall | 80 | Unchanged |
| Quick-service restaurants | 79 | Stable for a third year |
| National banks | 79 | Steady |
| Credit unions | 78 | Down 1% |
| Wireless service providers | 77 | Record high |
| Video streaming | 77 | Down 1% |
| Super regional banks | 77 | Down 3% |
| National average | 76.7 | Down 0.3% |
| Social media | 75 | Highest since 2010 |
| Online sports betting and iGaming | 74 | Down 3% |
| Internet service providers | 73 | Up 1% |
| Subscription TV | 72 | Highest ever recorded |
Sources: ACSI Finance, Restaurant and Food Delivery, Telecommunications, and Entertainment studies, 2026.
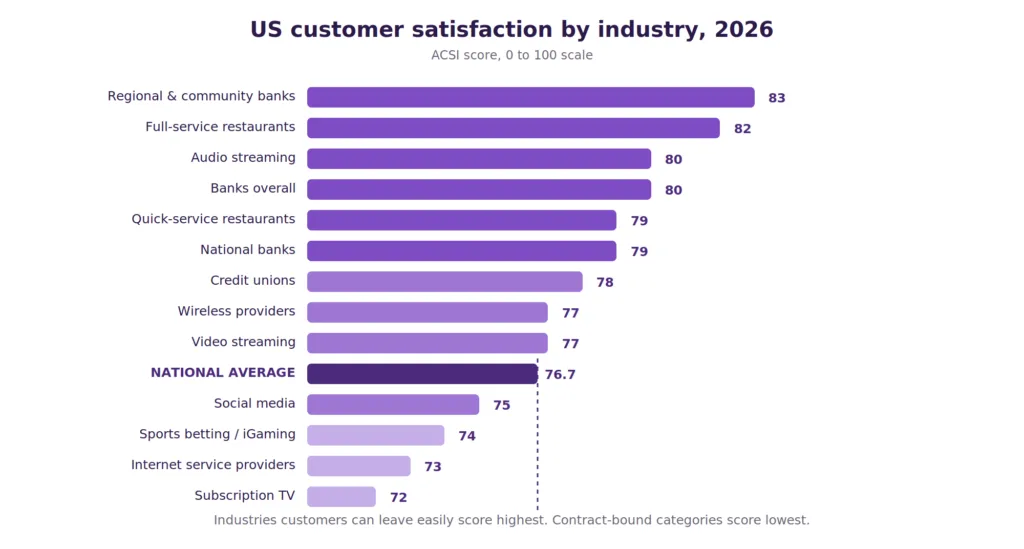
Chart of 2026 ACSI customer satisfaction scores across fourteen industries
The spread runs eleven points from subscription TV at 72 to regional banks at 83. An ISP scoring 76 is beating its industry by three points. A full-service restaurant scoring 76 is failing by six. Same number, opposite verdicts.
One pattern is consistent year after year. Industries where customers choose freely and switch easily score highest. Industries with contracts, bundling, and limited local competition score lowest. Satisfaction correlates with the ability to leave, which supports the concentration argument above.
For CSAT expressed as a percentage rather than an index score, 75 to 85% is the usual healthy band, with above 90% exceptional. Note that an ACSI index score and a CSAT percentage are not the same measurement and should not be compared directly.
How Customer Satisfaction Is Measured
Three metrics do most of the work, and each answers a different question.
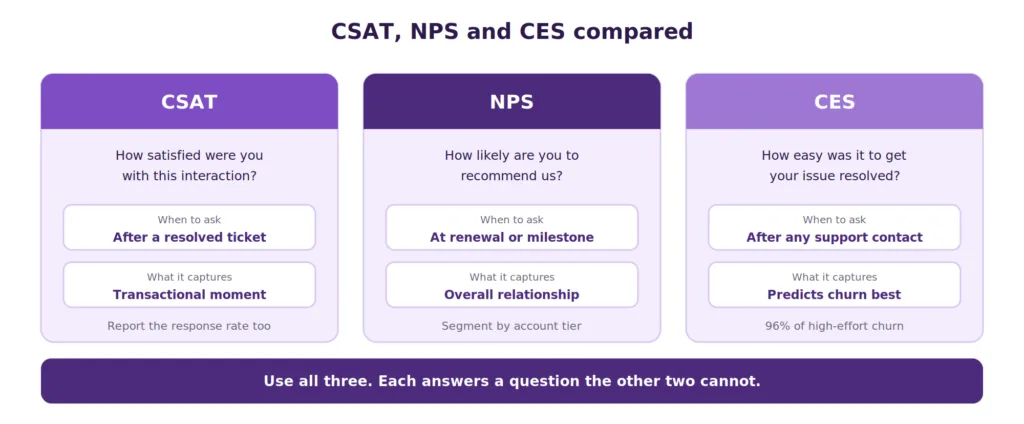
Comparison of CSAT, NPS, and CES showing what each measures and when to use it
CSAT
What it asks: How satisfied were you with this specific interaction?
Formula: positive responses divided by total responses, times 100.
Worked example: 400 people respond to a post-resolution survey and 340 select satisfied or very satisfied. CSAT is 340 divided by 400, or 85%.
When to use it: immediately after a defined interaction such as a resolved ticket or a completed order.
The limitation that nobody publishes alongside their score: response rate. A CSAT built on 4% of customers measures people who felt strongly enough to answer. Always report the response rate beside the score. There is more detail in this guide to customer satisfaction score.
NPS
What it asks: how likely are you to recommend us, on a 0 to 10 scale.
Formula: percentage of promoters scoring 9 to 10, minus percentage of detractors scoring 0 to 6.
Worked example: 300 responses with 150 promoters and 60 detractors gives 50% minus 20%, an NPS of 30.
When to use it: at relationship milestones such as renewal or ninety days after onboarding, rather than after every ticket.
The limitation: it measures the relationship, so it moves for pricing and product reasons a support team does not control. Detail sits in this guide to net promoter score.
CES
What it asks: How easy was it to get your issue resolved?
Formula: average of all effort ratings.
Worked example: 500 responses summing to 1,750 points on a seven-point scale gives a CES of 3.5.
When to use it: after any interaction where friction is the risk, particularly support resolution and onboarding.
Why it predicts loyalty best: Gartner found that 96% of customers who had a high-effort experience became disloyal, against 9% of those with a low-effort experience. Effort is the strongest available predictor of whether someone leaves, which is covered further in this guide to customer effort score.
The Models That Explain Satisfaction
Metrics tell you the level. Models tell you why it moved.
The expectancy-disconfirmation paradigm
The foundational academic model, developed by Richard Oliver in 1980 and still the basis of most satisfaction research. Customers form expectations before purchase, experience the product, then compare the two. A positive gap produces satisfaction, a negative gap produces dissatisfaction, and a match produces indifference.
The practical value is that it identifies two levers rather than one. You can improve the experience, or you can set expectations more accurately. Support teams inherit the consequences of marketing promises, which is why satisfaction problems sometimes originate outside support entirely.
SERVQUAL
Developed by Parasuraman, Zeithaml, and Berry in 1988, SERVQUAL measures service quality across five dimensions: reliability, assurance, tangibles, empathy, and responsiveness. Its value is diagnostic. A poor overall score becomes actionable once you know which of the five is dragging it down, and reliability consistently carries the most weight in service settings.
The Kano model
Noriaki Kano’s framework sorts attributes into three types. Basic needs cause severe dissatisfaction when absent and earn nothing when present, such as a website that loads. Performance needs improve satisfaction proportionally, such as response speed. Delighters produce disproportionate satisfaction when present and cost nothing when absent.
The operating instruction is sequencing. Delighters built on top of unmet basic needs are wasted investment, and most teams that feel their satisfaction work is not paying back have made exactly that mistake.
The ACSI model
The ACSI itself is a structural model rather than a simple average. It treats satisfaction as the output of perceived quality, perceived value, and customer expectations, feeding forward into loyalty and complaint behavior. That structure is why it can be compared across industries as different as banking and streaming.
What Satisfaction Does Not Tell You
This section is missing from most guides on this topic, and it is where the metric most often misleads.
Satisfaction is not loyalty. A satisfied customer with a better offer elsewhere still leaves. ACSI’s 2026 finding that retention rose while satisfaction stalled shows the reverse case too, where customers stay without being satisfied because switching is hard.
Satisfaction is not a measure of your product. It measures the gap between expectation and delivery, so lowering expectations raises satisfaction without improving anything. Any satisfaction program should check whether scores improved because delivery got better or because promises got smaller.
A single score hides its own composition. A blended 80% across billing, technical, and onboarding can be 92% on onboarding and 61% on billing. The blended number tells you to do nothing, and the segmented number tells you exactly where to work.
Silence is not satisfaction. Most dissatisfied customers never complain. Low complaint volume alongside falling repeat purchase rates is a warning rather than a clean bill of health.
How to Improve Customer Satisfaction
Five approaches, ordered by how reliably they move the number.
Reduce effort before adding delight. Effort predicts churn better than satisfaction predicts loyalty, and it is usually cheaper to remove friction than to create surprise. Look first at transfers, repeated identity checks, and any point where a customer explains something twice.
Resolve on first contact. Every repeat contact is a satisfaction cost, and first contact resolution is among the strongest predictors of CSAT. Agents need context, documentation, and the authority to decide. The practical route runs through first call resolution.
Set expectations accurately. Since satisfaction is a comparison, an accurate promise is worth as much as a faster resolution. Publish realistic response times rather than aspirational ones, and communicate delays before customers ask.
Fix basic needs before delighters. Apply the Kano sequencing test to any satisfaction initiative. If your help center search does not work, a surprise thank-you gift will not compensate.
Close the loop visibly. Collecting feedback without acting on it produces measurable cynicism and falling response rates. Tell customers what changed as a result of what they said.
Where Kayako Fits
Satisfaction improves when resolution improves, which is where support tooling actually contributes.
Kayako’s AI agent resolves routine questions directly from your knowledge base, which lowers effort by removing the wait entirely for the questions that have documented answers. SingleView keeps full customer history on one record, so nobody explains their problem twice, and that repetition is among the most reliable sources of high effort scores. Reporting runs on resolution rather than volume, so you can see which issue types are producing repeat contacts.
Trilogy provides a concrete example. After moving to Kayako, the team removed 80% of ticket volume, reached 76% autonomous resolution, and cut ticket age from 17.6 hours to under two minutes during a 90-day rollout.
Customer satisfaction is the gap between what a customer expected and what they received, which makes it a comparison rather than a verdict on quality. That definition explains why identical service produces different scores, why over-promising damages support teams, and why a score is meaningless without an industry benchmark beside it.
The 2026 data makes the benchmark point urgent. The national ACSI score has not moved since 2013 despite enormous investment, complaints are at record levels, and the industry spread runs eleven points from subscription TV to regional banks. Your position against your own sector is the signal worth watching.
Start by segmenting your CSAT by issue type and publishing the response rate beside it. A blended score with an unstated response rate is the most common way satisfaction reporting misleads the people relying on it.
Frequently Asked Questions
What is customer satisfaction in simple terms?
Customer satisfaction is how well a product, service, or experience met the expectations a customer had beforehand. It is a comparison between what was expected and what was delivered rather than a judgment of quality on its own.
What is a good customer satisfaction score?
It depends on your industry. On ACSI’s 0 to 100 scale, the national average is 76.7, with industry scores in 2026 ranging from 72 for subscription TV to 83 for regional and community banks. For CSAT expressed as a percentage, 75 to 85% is generally healthy, and above 90% is exceptional.
What is the difference between CSAT, NPS, and CES?
CSAT measures satisfaction with a specific interaction. NPS measures willingness to recommend and reflects the overall relationship. CES measures how much effort the customer had to expend, and it predicts churn better than the other two.
How is customer satisfaction calculated?
The standard CSAT calculation divides positive survey responses by total responses and multiplies by 100. If 340 of 400 respondents select satisfied or very satisfied, CSAT is 85%. Always publish the response rate alongside the score.
What is the ACSI?
The American Customer Satisfaction Index is a national economic indicator founded in 1994 at the University of Michigan. It measures around 400 companies across more than 40 industries using approximately 200,000 interviews a year, and publishes scores on a 0 to 100 scale.
What are the main customer satisfaction models?
The expectancy-disconfirmation paradigm, developed by Richard Oliver in 1980, is the academic foundation. SERVQUAL measures service quality across five dimensions. The Kano model sorts features into basic needs, performance needs, and delighters. The ACSI is itself a structural model linking quality, value, and expectations to loyalty.
Does customer satisfaction predict loyalty?
Only partly. Satisfied customers still leave for better offers, and dissatisfied customers sometimes stay because switching is difficult. Customer Effort Score is a stronger predictor, with Gartner finding 96% of high-effort customers becoming disloyal, compared with 9% of low-effort ones.
Why has customer satisfaction not improved despite CX investment?
ACSI data shows the national score at the same level as 2013 despite well over $100 billion invested annually. Two contributing explanations are that spending has concentrated on measurement rather than on removing friction, and that market concentration has reduced the consequences of dissatisfaction for sellers.
How often should customer satisfaction be measured?
CSAT immediately after each defined interaction, NPS at relationship milestones such as renewal, and CES after any interaction where friction is a risk. Surveying everything produces fatigue, low response rates, and biased samples.
What is the difference between customer satisfaction and customer experience?
Satisfaction is one outcome measured at a point in time. Customer experience is the sum of every interaction a customer has with a company. Strong experience tends to produce sustained satisfaction, and satisfaction on its own does not describe the whole relationship.