
What Is Net Revenue Retention (NRR)? A Complete Walkthrough
Imagine two SaaS companies, each starting the year with $20 million in ARR. One lands zero new customers for twelve months. At year end it has grown to $24 million. The other, also with zero new customers, ends the year at $19 million. What explains the difference? Net Revenue Retention.
SaaS companies with high NRR grow 2.5x faster than their low-NRR counterparts (High Alpha, 2024 SaaS Benchmarks Report). That compounding gap is why NRR has become the single most-watched metric in SaaS boardrooms. It answers the question every investor, founder, and customer success leader needs to know: how much revenue are we extracting from the customers we already have?
This guide covers the full definition, the formula, the benchmarks, real company examples including ServiceNow and Snowflake, what drives the number, how to improve it, and why investors treat it as a valuation input rather than just a KPI.
What Is Net Revenue Retention (NRR)?
Net Revenue Retention (NRR), also called Net Dollar Retention (NDR), measures the percentage of recurring revenue retained from a cohort of existing customers over a defined period, after accounting for expansion revenue (upsells, cross-sells, seat growth, price increases), contraction (downgrades), and churn (cancellations).
The defining characteristic of NRR is that it can exceed 100%. When expansion revenue from existing customers outpaces churn and contraction combined, the business grows its revenue base without acquiring a single new customer. That is the mechanical definition of efficient, compounding growth.
NRR is tracked primarily by SaaS companies, subscription businesses, and any recurring-revenue operation where the customer relationship extends beyond the initial sale. It is not a meaningful metric for transactional businesses without a recurring component.
The simplest mental model: if you signed zero new customers this year, would you have more or less revenue at year end than at the start? That answer is your NRR.
In 2025, existing customers generate 40% of new ARR across the B2B SaaS market, rising to over 50% for companies above $50 million ARR (Pavilion 2025 SaaS Benchmarks). NRR is the metric that captures and quantifies that contribution.
The Net Revenue Retention Formula and How to Calculate It
The standard NRR formula
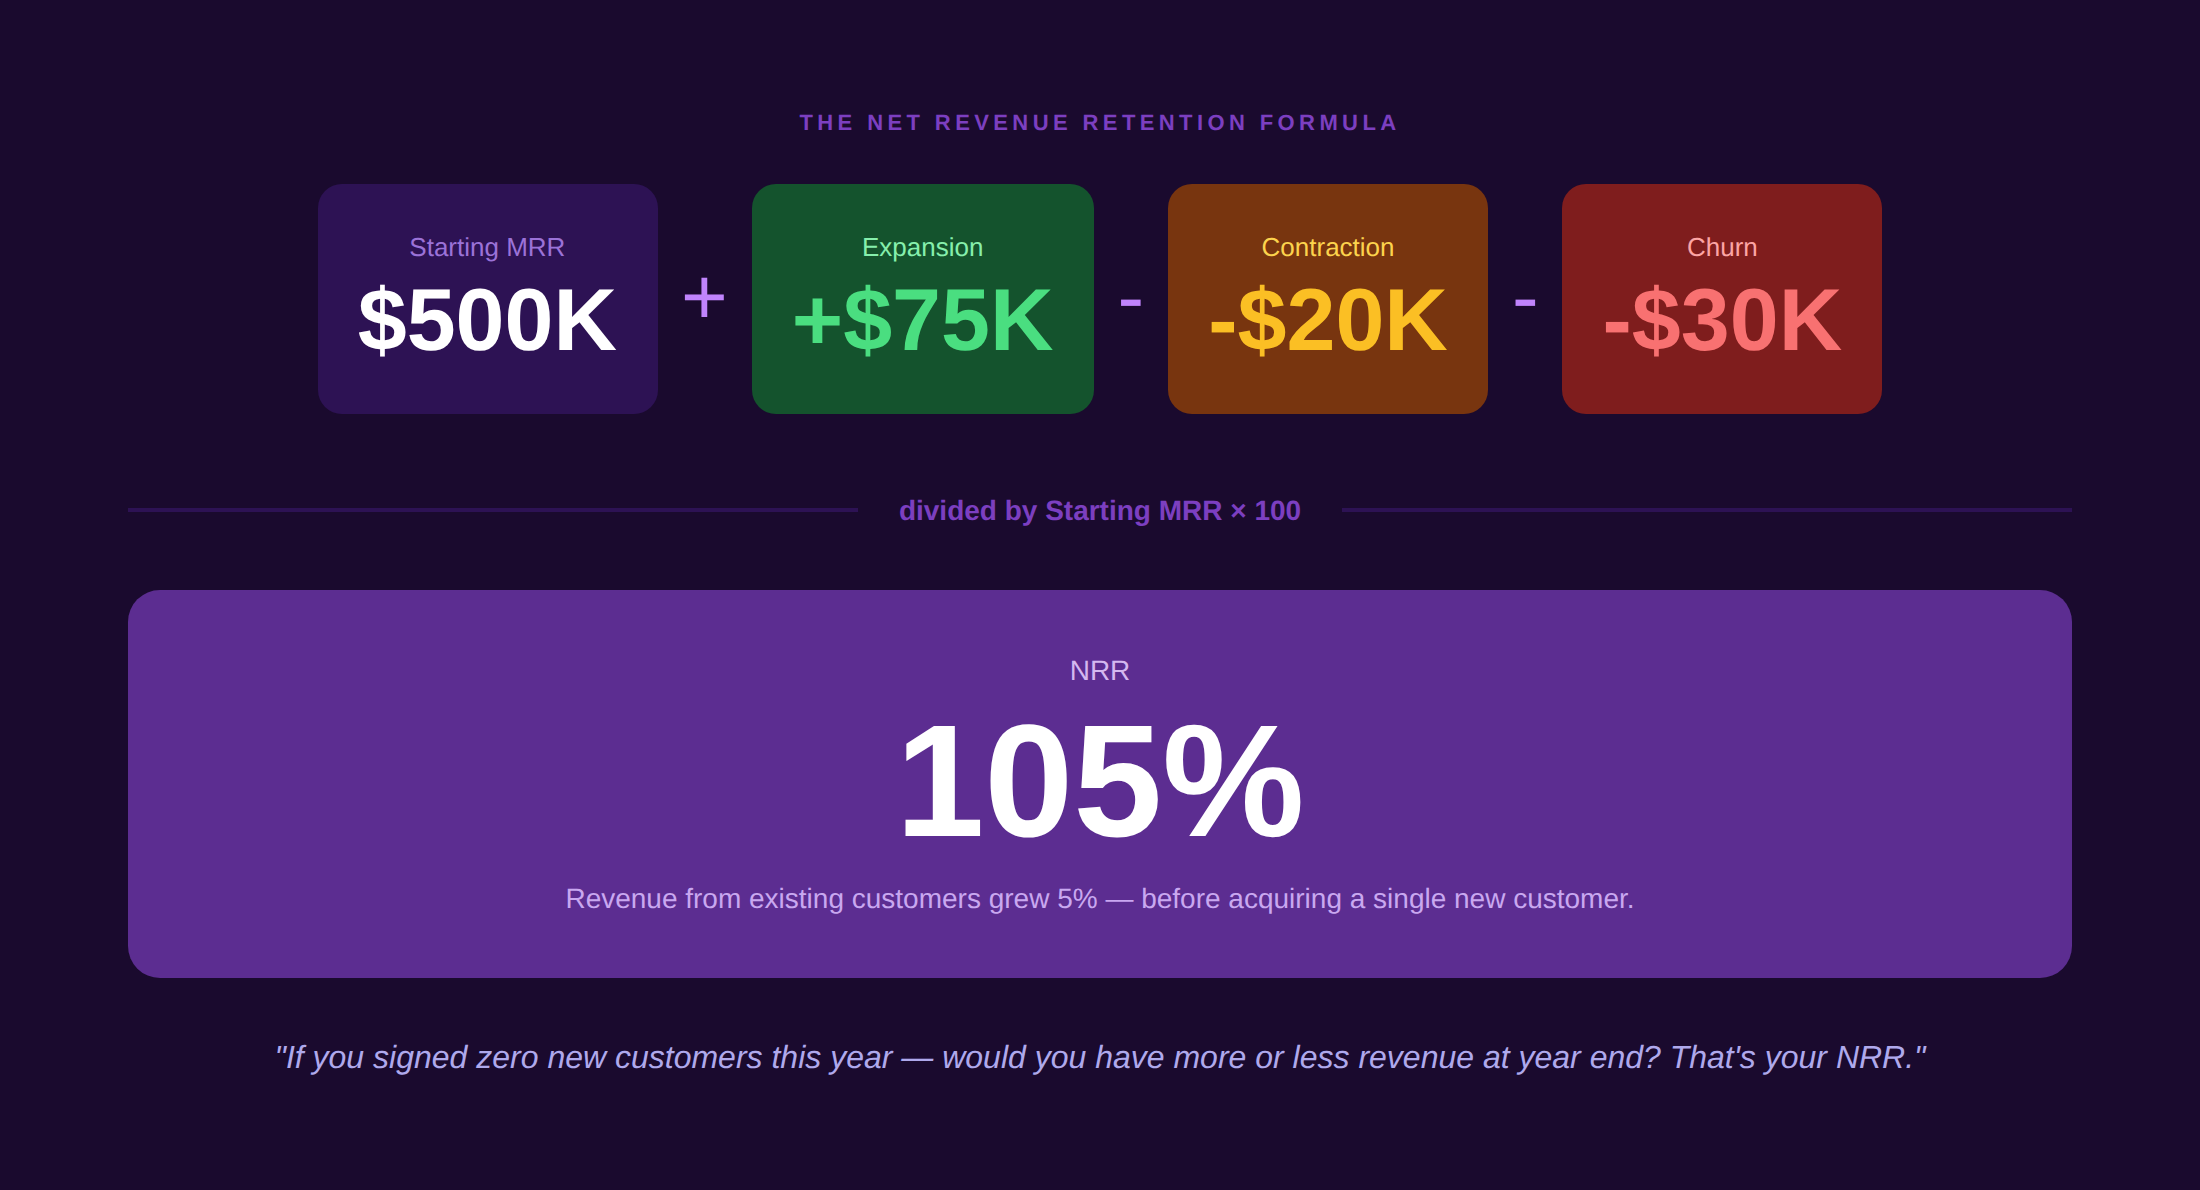
NRR = (Starting MRR + Expansion Revenue – Contraction Revenue – Churned Revenue) / Starting MRR x 100
Where:
- Starting MRR is the monthly recurring revenue from the cohort of existing customers at the beginning of the measurement period
- Expansion Revenue is additional MRR from that same cohort during the period, from upsells, cross-sells, seat additions, or price increases
- Contraction Revenue is the reduction in MRR from that same cohort, from downgrades or plan reductions
- Churned Revenue is MRR lost because customers in that cohort canceled entirely
The formula can be calculated at MRR (monthly) or ARR (annual) level. The output is a percentage. A result above 100% means the cohort is growing in revenue terms; below 100% means it is shrinking.
Worked numerical example
NRR calculation example
Starting MRR from existing customers: $500,000
Expansion revenue (upsells and seat additions): +$75,000
Contraction (downgrades): -$20,000
Churned MRR (cancellations): -$30,000
Ending MRR from that cohort: $500,000 + $75,000 – $20,000 – $30,000 = $525,000
NRR = ($525,000 / $500,000) x 100 = 105%
Interpretation: This company grew revenue from its existing customers by 5% in the period,
before any contribution from new customer acquisition.
Cohort vs. company-level NRR
Cohort-level NRR measures a specific group of customers over a defined window, for example, everyone who was a customer in January 2024, measured over 12 months. Company-level NRR aggregates across all cohorts and is the figure typically reported to investors. Both are valid; cohort analysis reveals retention trends earlier because it isolates behavioral patterns before they appear in aggregate data.
Use Kayako’s CSAT calculator alongside NRR tracking to understand whether your satisfaction scores are predicting your retention outcomes. Strong CSAT at the interaction level is often a leading indicator of healthy NRR at the account level.
Net Revenue Retention vs. Gross Revenue Retention
The key difference
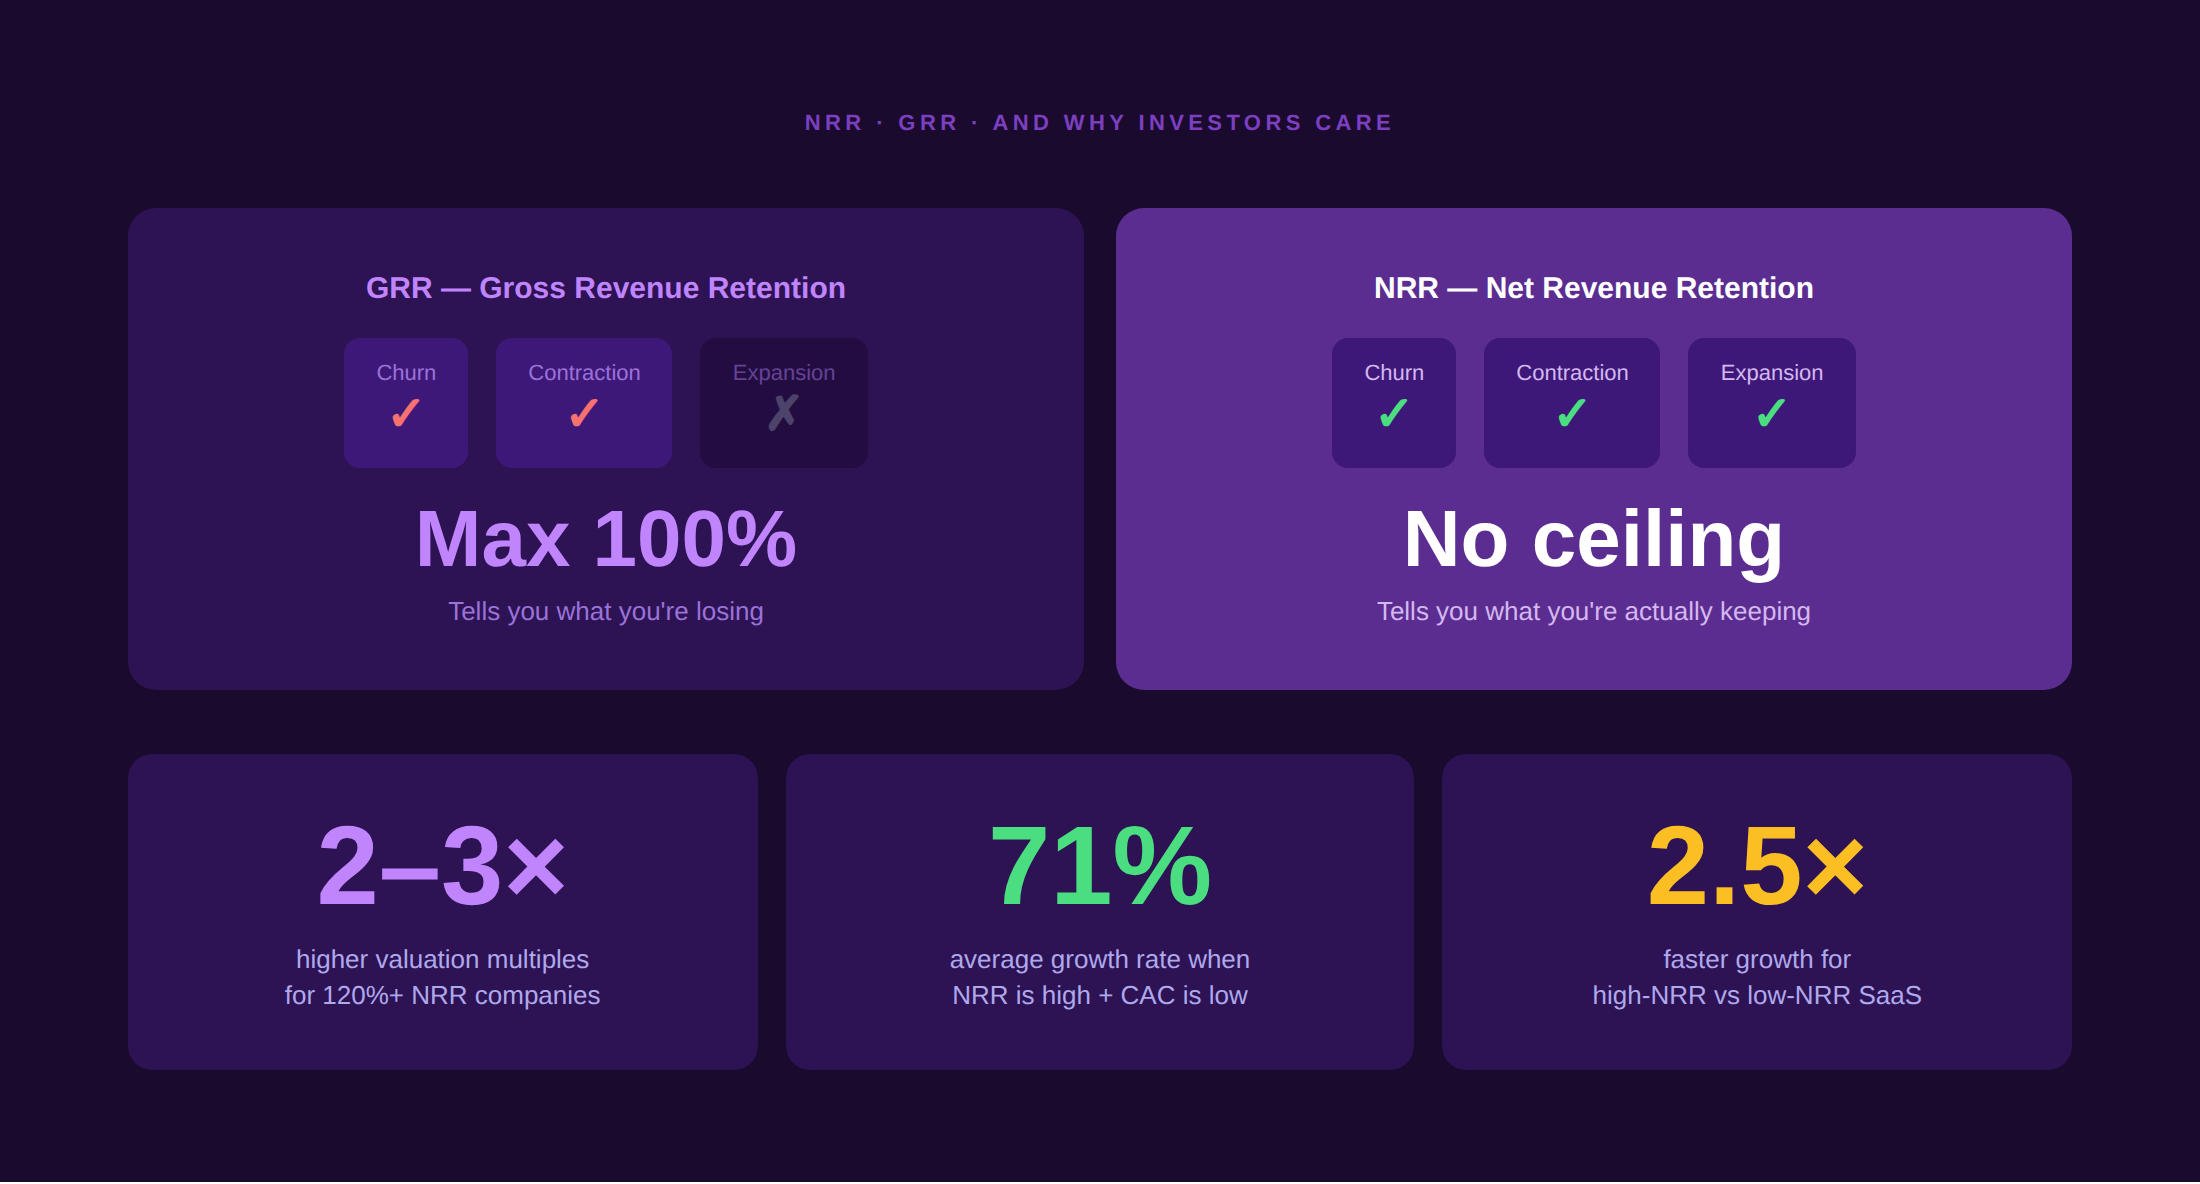
Gross Revenue Retention (GRR) measures the percentage of revenue retained from existing customers after churn and contraction, but excludes expansion revenue. Because it cannot capture upside, GRR can never exceed 100%.
NRR includes expansion revenue, which is why it can exceed 100%. The relationship between the two metrics reveals the structure of the business:
- GRR tells you how good you are at keeping what you have. It is a pure churn signal.
- NRR tells you whether you are growing what you keep. It combines retention quality with expansion capability.
What investors read from both together
A company with 95% GRR and 120% NRR has strong churn prevention and strong expansion motion. A company with 95% GRR and 100% NRR has strong churn prevention, but little expansion is happening. A company with 80% GRR and 105% NRR has significant churn being masked by heavy upselling, which is a warning sign: the expansion engine is compensating for a retention problem, and when that expansion slows, both metrics will deteriorate simultaneously.
Investors who understand SaaS look at GRR first to assess the floor. Then they look at NRR to assess the ceiling. A business with a healthy GRR and high NRR is compounding in both directions.
| GRR (Gross Revenue Retention) | NRR (Net Revenue Retention) | |
| Includes churn | Yes | Yes |
| Includes contraction | Yes | Yes |
| Includes expansion | No | Yes |
| Maximum value | 100% | Unlimited |
| What it signals | Churn prevention quality | Retention and expansion combined |
| Typical good benchmark | Above 85% (SMB), 90%+ (enterprise) | Above 100%, 120%+ top quartile |
Kayako’s customer support platform helps SaaS teams reduce ticket volume and improve customer outcomes that directly protect NRR. See How It Works
What Is a Good Net Revenue Retention Rate?
The benchmarks vary by company stage, customer segment, and ACV. Context matters more than the raw number.
The Bessemer Ventures framework
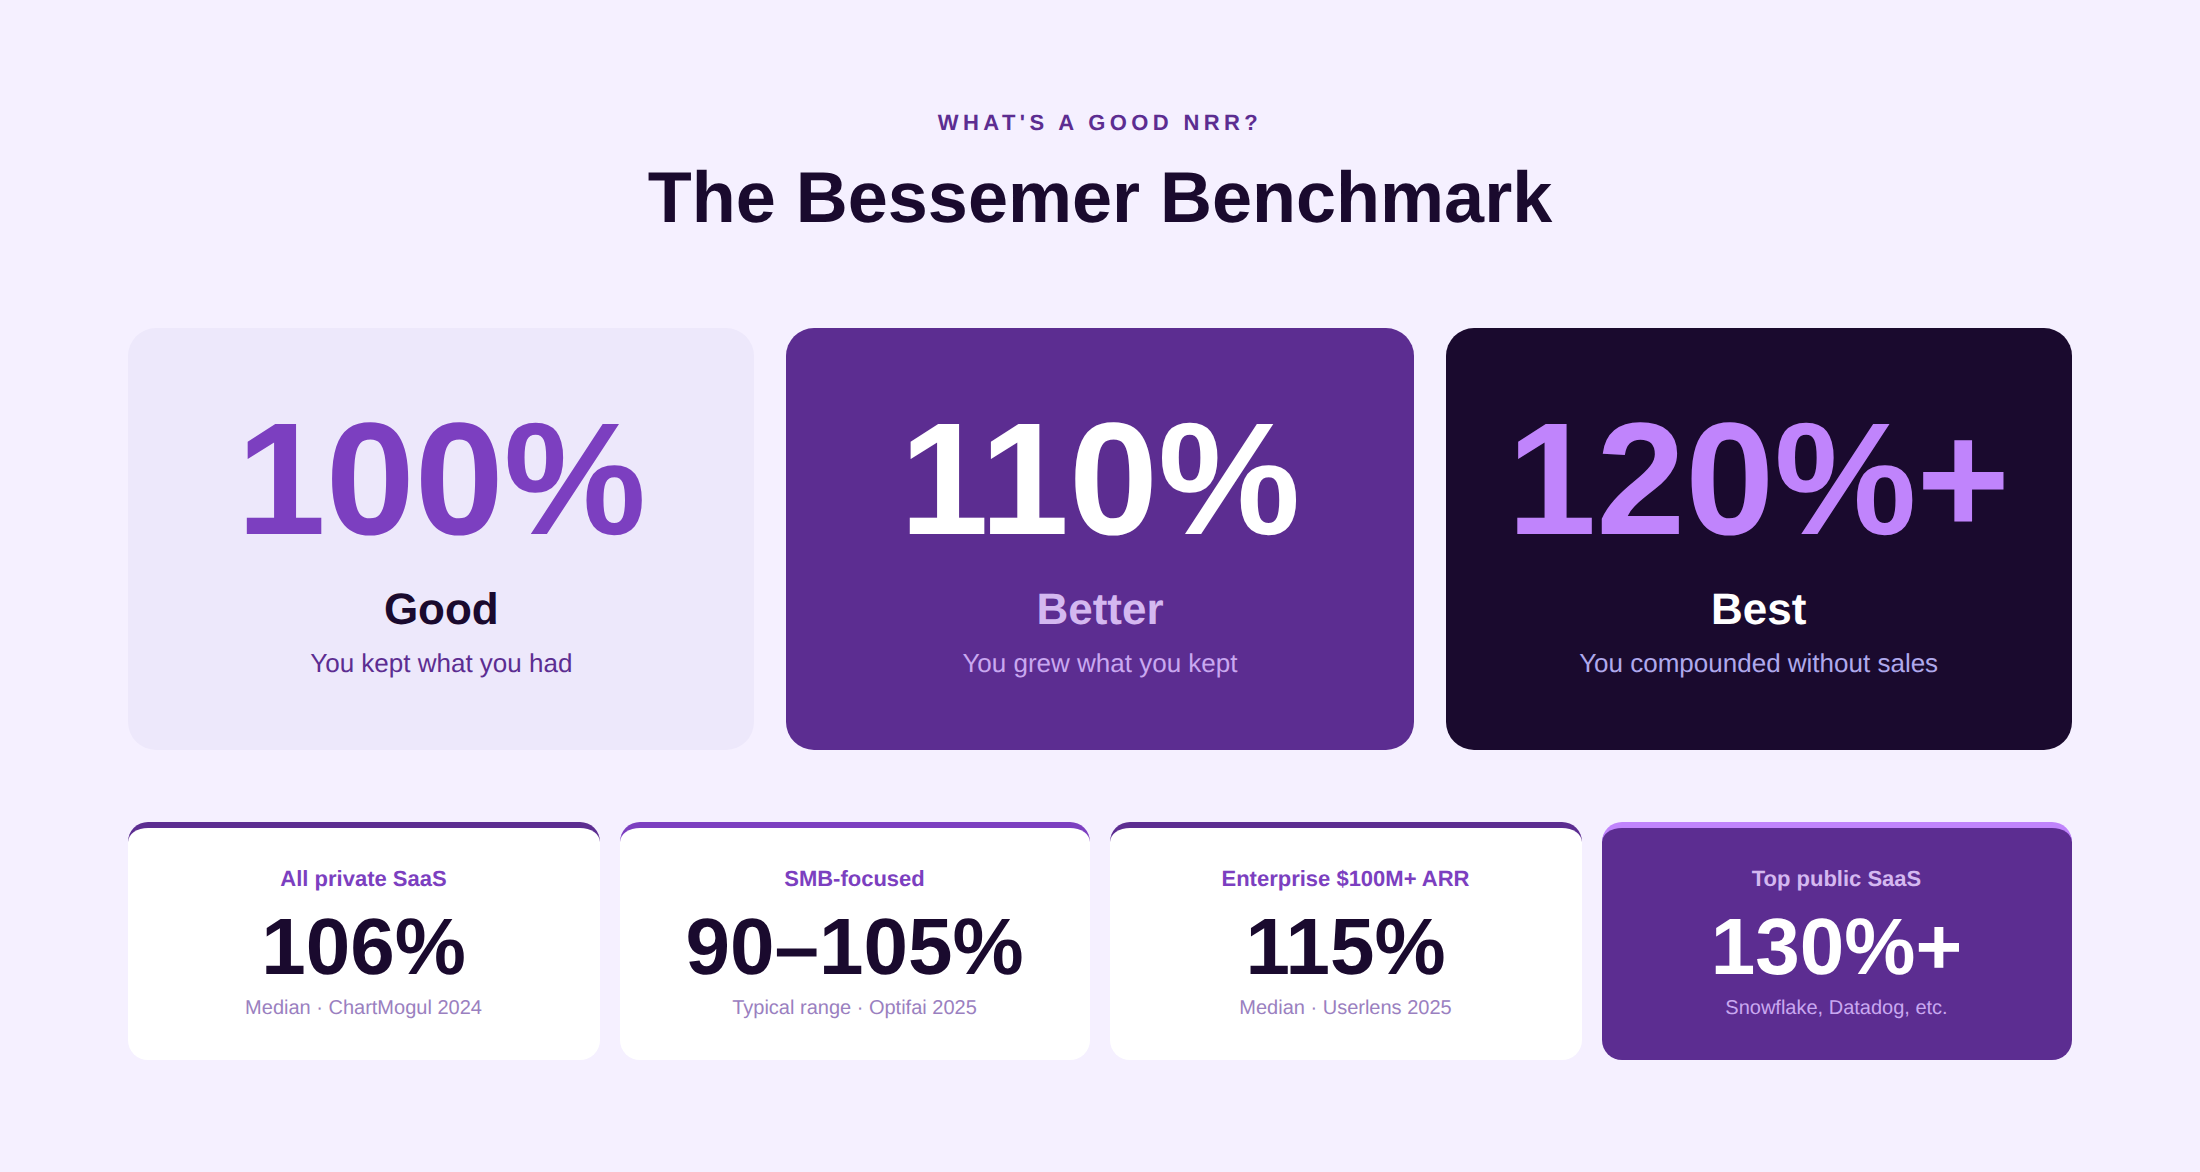
100% NRR is considered “Good.” 110% is “Better.” 120% or above is “Best.” (Bessemer Venture Partners, State of the Cloud 2023). This three-tier framing is the most widely cited in venture capital and has become the de facto language of SaaS board reporting.
Benchmarks by company size and ACV
| Segment | Median NRR | Top Quartile NRR | Source |
| All private SaaS (median) | 106% | Above 120% | ChartMogul 2024, n=2,100 |
| Bootstrapped SaaS $3M-$20M ARR | 103% | 117.9% (90th pct) | SaaS Capital 2026 |
| SMB-focused SaaS | 90-105% | 110%+ | Optifai, 2025 |
| Mid-market SaaS | 100-110% | 115-120% | Optifai, 2025 |
| Enterprise SaaS ($100M+ ARR) | 115% | 125%+ | Userlens 2025 |
| ACV $25K-$50K | 102% | 111% | SaaS Capital 2025 |
Key insight: higher ACV is the strongest predictor of higher NRR. Enterprise customers who went through a long sales process, deep implementation, and dedicated support are structurally stickier than SMB customers and have more room to expand.
Real-World NRR Examples from Public SaaS Companies
Snowflake: the peak benchmark
Snowflake reported 169% NRR at IPO in 2020, which is the highest ever recorded at public market scale for a cloud company. Its consumption-based pricing model meant that as customers’ data workloads grew, their Snowflake spend grew automatically. NRR eventually normalized toward 130% as the customer base matured and new enterprise logos started at lower initial spend. The lesson: usage-based pricing and a product that grows with customer success are the structural engine behind best-in-class NRR.
ServiceNow: consistent high renewal rates
ServiceNow consistently reports renewal rates above 98% and NRR in the 120-125% range (ServiceNow investor relations). Its deep workflow integrations make the platform extraordinarily sticky: replacing ServiceNow requires not just switching software but rebuilding years of custom workflows. The enterprise lesson is clear: products embedded in operational workflows command the highest GRR, and account expansion (new modules, additional departments, global rollouts) drives NRR above 100%.
Datadog: land-and-expand at scale
Datadog has reported NRR consistently above 130% through its land-and-expand model. New customers typically adopt one monitoring product (infrastructure, for example), then expand into APM, log management, security monitoring, and synthetics over subsequent contract periods. Each additional product adds ARR from the same account. NRR above 130% sustained over multiple years at scale is what drove Datadog’s premium valuation multiples.
Atlassian: PLG driving expansion
Atlassian’s product-led growth model creates natural NRR expansion without a traditional enterprise sales force. New users in an organization adopt Jira or Confluence, usage spreads across teams organically, and seat counts grow without a renewal conversation. NRR around 120-125% at scale reflects both the virality of the product and the absence of churn incentives when the tool is already embedded in development workflows.
What these examples share
Each company with exceptional NRR has three things in common: a product that becomes more valuable as the customer uses it more, pricing that grows naturally with that usage, and a customer success motion that prevents churn before it becomes a renewal conversation. Those three factors are what the improvement section below addresses.
What Drives Net Revenue Retention
Expansion revenue: the upside component
Expansion revenue is any additional MRR from existing customers that was not in the original contract. It comes in four forms: upsells (higher-tier plans), cross-sells (additional products), seat additions (more users), and price increases (contractual or at renewal). Expansion is what allows NRR to exceed 100%, and it is the lever with the highest return on investment because the customer relationship, implementation, and trust already exist.
Churn: the floor below zero
Churned revenue directly reduces the numerator in the NRR formula without any offsetting factor. A customer who cancels at $50,000 ARR requires $50,000 of expansion from the remaining base just to replace them. Churn prevention is therefore not just a retention activity: it is a growth activity. Every percentage point improvement in GRR drops directly into NRR.
Contraction: the silent NRR killer
Customers who downgrade from enterprise to professional plans, reduce seat counts during layoffs, or negotiate contract concessions at renewal all generate contraction revenue. Contraction is often underreported in NRR analysis because it does not appear in logo churn numbers. A company with 100% logo retention but 20% contraction rate will have a significantly sub-100% NRR.
Price increases and contract engineering
Annual price escalators built into multi-year contracts generate expansion revenue without any product change or customer success intervention. A 5% annual escalator on a $100,000 contract adds $5,000 to NRR automatically. This is why multi-year contract negotiation, with built-in escalators, is both a sales and an NRR strategy.
How to Improve Your Net Revenue Retention Rate
Build a customer success program before you need one
The most effective NRR improvement intervention is preventive. Customer success programs that identify at-risk accounts 60-90 days before renewal, trigger health score alerts based on usage data, and provide structured quarterly business reviews convert potential churners into renewed accounts. Reactive churn management, which kicks in after a cancellation notice, recovers a fraction of the accounts that proactive CS would have retained.
See how customer success metrics translate into actionable account health signals for CS teams.
Design your pricing tiers for natural expansion
Usage-based pricing, seat-based expansion, and feature-tier upgrades that align with natural customer growth stages create expansion revenue without a sales conversation. The goal is to design a pricing structure where a growing customer’s logical next action is to upgrade, not to stay on the current tier. When the price-to-value relationship is visible at every tier, customers self-select into expansion.
Run expansion playbooks on every renewal
Every renewal conversation is an expansion opportunity. Account managers who arrive at a renewal discussion with a prepared expansion proposal, supported by usage data showing which features are most adopted and which are unused, convert significantly more renewals into expansions. A structured expansion playbook covering product adoption analysis, whitespace mapping, and competitive positioning turns a renewal into a growth event.
Reduce support friction at every touchpoint
Customers who have frustrating customer service experiences during the contract period are significantly more likely to downgrade or churn at renewal. Support quality is not just an operational metric: it is an NRR input. Fast resolution, proactive communication on known issues, and omnichannel support that reduces customer effort all protect the renewal.
Monitor usage data as a churn prediction signal
Login frequency, feature adoption rates, and active user counts are early warning signals for churn that appear weeks or months before a cancellation request. Companies leveraging product usage data report retention rates 15% higher than those that do not (Userlens). Building automated health score triggers that route low-engagement accounts to CS teams is the highest-leverage early intervention available.
Why Investors Care About NRR
NRR is not just a operational metric for SaaS companies. It is a valuation input.
NRR drives revenue multiples
A company with 120% NRR might command 2 to 3 times higher valuation multiples than one with 95% NRR at similar growth rates (Fullview, 2025). The reason is mathematical: high NRR companies grow their existing revenue base automatically, meaning a larger share of their future revenue is already contracted. That predictability is worth paying for.
The compounding growth argument
A company with 120% NRR doubles its ARR from existing customers in roughly 4.2 years without a single new customer. A company with 90% NRR loses 10% of its ARR base annually and must replace that from new business just to stand still. The capital efficiency difference is enormous: high-NRR companies spend proportionally less on sales and marketing relative to revenue because their existing customers are already growing.
The Rule of 40 connection
Companies with high NRR and low CAC payback periods achieve an average 71% growth rate and 47% Rule of 40 score, versus 10% growth and 5% Rule of 40 for companies with low NRR and high CAC payback (Growth Unhinged 2025 SaaS Benchmarks). NRR is one of the two strongest predictors of long-term, profitable growth in SaaS: the other is CAC efficiency. Investors who understand this look at both metrics before looking at anything else.
Common Mistakes When Calculating NRR
- MRR vs ARR confusion. Mixing monthly and annual figures in the same formula produces incorrect results. Use MRR throughout for monthly calculations, or ARR throughout for annual. Never combine them.
- Excluding contraction from the formula. Some teams calculate NRR using only churn and expansion, treating downgrades as a separate metric. This overstates NRR and produces misleading cohort comparisons. Contraction must be included.
- Inconsistent measurement windows. Comparing a 12-month NRR from Q1 cohorts to a 6-month NRR from Q4 cohorts will always produce different results, regardless of underlying performance. Standardize the measurement window before comparing periods.
- Mixing logo retention with revenue retention. A company can have 95% logo retention but 85% revenue retention if the churned customers were disproportionately large. Always calculate NRR on revenue, not headcount.
- Including one-off revenue. Professional services fees, implementation charges, and non-recurring revenue items should be excluded from the NRR calculation. Only recurring revenue belongs in the formula.
- Not segmenting by cohort or ACV tier. Company-level NRR can mask severe deterioration in a specific segment. An enterprise tier with 130% NRR can obscure an SMB tier with 75% NRR. Always segment before reporting.
Best Tools and Software to Track NRR
ChartMogul
Best for: SaaS companies wanting the most comprehensive subscription analytics platform available. Native MRR and ARR reporting, cohort analysis, NRR trending, and segment filtering. Integrates with Stripe, Braintree, Recurly, and most billing systems directly.
Maxio (formerly SaaSOptics)
Best for: Mid-market SaaS companies needing both subscription management and financial analytics in one platform. Strong revenue recognition compliance alongside NRR and cohort reporting.
Baremetrics
Best for: Early-stage SaaS teams wanting fast deployment and clean dashboards. Direct Stripe integration, real-time NRR tracking, and churn forecasting. The simplest path from billing data to retention metrics.
ProfitWell Metrics (Paddle)
Best for: Companies using Paddle for billing and payments. NRR reporting is built into the Paddle dashboard. ProfitWell Retain adds automated churn reduction workflows on top of the metrics layer.
Gainsight
Best for: Enterprise CS teams wanting NRR tied to account health scores, success plans, and automated playbook triggers. Gainsight connects usage data, support activity, and renewal status into a single customer health view that predicts NRR movement before it happens.
Planhat
Best for: Mid-market companies wanting a customer success platform with strong NRR and expansion reporting. Combines CS workflows with revenue analytics in a single interface.
Recurly
Best for: Subscription businesses with complex billing models (usage, seats, hybrids). Strong built-in analytics, including churn, MRR movement, and NRR-equivalent metrics across billing configurations.
Kayako’s support platform gives CS teams the interaction data and customer context they need to protect NRR at renewal. Book a Strategy Session
Case Studies: Top SaaS Companies by NRR
Snowflake: 158% peak NRR and the usage-based model
Snowflake’s peak reported NRR of 158% in fiscal year 2022 is the highest sustained by a public company at scale. The mechanism was consumption-based pricing: customers paid for what they used, and as they migrated more workloads to the cloud, their Snowflake consumption grew naturally. There was no upsell conversation required, no sales motion, and no contract renegotiation. The product design made expansion the path of least resistance. For teams designing their own pricing, the Snowflake model argues that usage-based components, where the customer’s spend grows as their success grows, produce the highest structural NRR ceiling.
Datadog: 130%+ through product expansion
Datadog’s NRR has remained above 130% through a deliberate product expansion strategy: build a new monitoring capability, offer it to existing customers at a low incremental price, watch adoption spread, and price the next product accordingly. Each new product launch became an NRR expansion event for the existing customer base. The lesson: NRR is a product strategy metric as much as a CS metric. The roadmap should be designed with expansion revenue in mind, not just feature coverage.
ServiceNow: 98% renewal rates through workflow lock-in
ServiceNow’s NRR consistency comes from a different source than Snowflake or Datadog: extreme product stickiness from deep workflow integration. When your IT service management, HR workflows, customer service operations, and change management processes all run through one platform, switching costs are existential. Customers renew not because a CS team convinced them to, but because the operational cost of leaving exceeds the cost of any alternative. The lesson: building products that are embedded in core operational workflows is the most defensible path to consistently high GRR, which is the foundation of consistently high NRR.
The private company application
Most SaaS companies do not have Snowflake’s consumption model or ServiceNow’s enterprise lock-in. The practical lessons from these case studies are: build pricing tiers that grow with customer usage; invest in product breadth that gives existing customers additional modules to adopt; build deep integration points that increase switching costs; and invest in CS programs that identify expansion opportunities before customers consider switching.
At the end of each quarter, a business with bated breath looks whether its financial sheets are in the green or not. While in the somewhat confusing matrix of offers, customer retention, and new customer acquisition, an enterprise might see light if its data sources report positive NRR. Because at the end, a business needs to be sustainable beyond its competition with the integrity of its high-class services towards its customers.
FAQs
What is Net Revenue Retention (NRR)?
Net Revenue Retention (NRR), also known as Net Dollar Retention (NDR), measures the percentage of recurring revenue retained from a cohort of existing customers over a period, including all expansion revenue (upsells, cross-sells, seat additions, price increases), minus contraction (downgrades) and churn (cancellations). An NRR above 100% means a business grows revenue from existing customers without acquiring new ones. It is considered the most important SaaS KPI for sustainable growth.
What is the Net Revenue Retention formula?
NRR = (Starting MRR + Expansion – Contraction – Churned MRR) / Starting MRR x 100. Use MRR or ARR consistently; never mix the two. Include all four components, including contraction, which is frequently omitted incorrectly. A worked example: Starting MRR $500K, expansion $75K, contraction $20K, churn $30K gives ending MRR of $525K and NRR of 105%.
What is a good NRR rate?
Using the Bessemer Ventures framework: 100% is Good, 110% is Better, 120%+ is Best. Median private SaaS NRR is 106% (ChartMogul 2024). Enterprise-focused companies typically achieve 115-125%. SMB-focused companies typically achieve 90-105%. A good NRR for your company depends on your ACV tier: SaaS Capital benchmarks show that companies with an ACV of $25K to $50K have a median NRR of 102% and a top-quartile NRR of 111%.
What is the difference between GRR and NRR?
GRR (Gross Revenue Retention) excludes expansion revenue and therefore cannot exceed 100%. It measures churn prevention quality. NRR (Net Revenue Retention) includes expansion revenue and can exceed 100%. It measures retention quality plus the ability to grow existing accounts. GRR is the floor; NRR is the ceiling. A company with high GRR but low NRR has good retention but a weak expansion motion. A company with low GRR but high NRR has a churn problem being masked by upselling.
What is ServiceNow’s Net Revenue Retention rate?
ServiceNow consistently reports renewal rates above 98% and NRR in the 120-125% range, driven by deep workflow integrations that make the platform extremely sticky and by systematic account expansion through new modules and additional departments within existing enterprise accounts. ServiceNow’s NRR is considered one of the most consistent in enterprise SaaS.
How can a SaaS company improve its NRR?
The five highest-leverage NRR improvement strategies are: build a proactive customer success program that identifies at-risk accounts 60-90 days before renewal; design pricing tiers that create natural expansion paths; run structured expansion playbooks at every renewal; reduce support friction to protect the customer relationship (faster resolution, better customer service, omnichannel accessibility); and monitor product usage data to predict churn before it becomes a cancellation request.
Why do investors care about NRR?
High NRR companies demonstrate that their existing customer base will continue growing in revenue terms without additional acquisition spend. This is the definition of capital-efficient growth. Companies with 120%+ NRR command 2 to 3 times higher valuation multiples than those with 95% NRR at similar growth rates. NRR also feeds directly into the Rule of 40, which combines growth rate and profitability margin: companies with high NRR and low CAC payback achieve an average 71% growth rate and 47% Rule of 40 score, the “cash cow zone” of SaaS metrics performance.