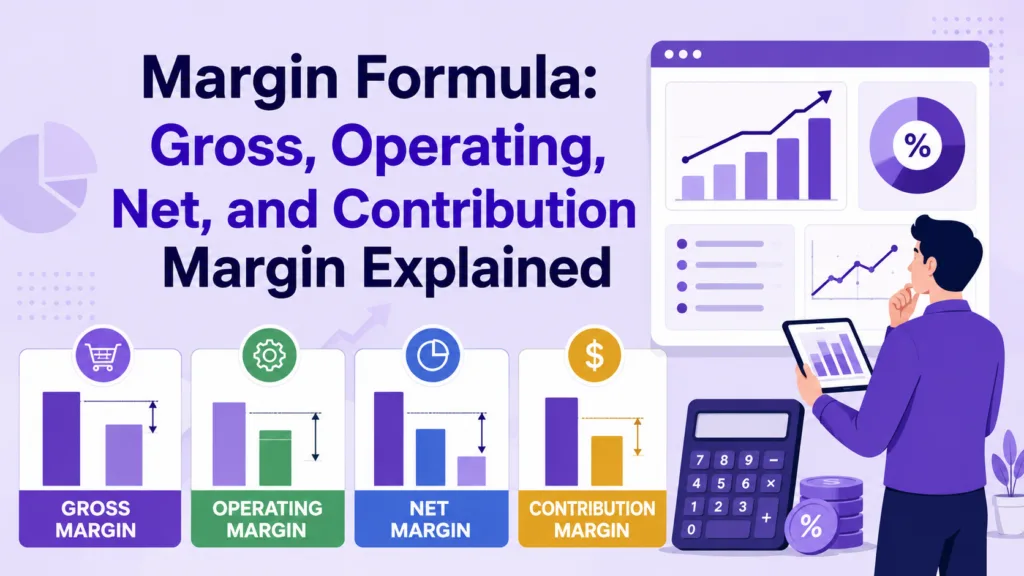
Quick summary: A margin measures how much of your revenue you keep as profit at a given stage. The core formulas are gross margin (Revenue minus COGS, over Revenue), operating margin (operating income over revenue), net profit margin (net income over revenue), and contribution margin (revenue minus variable costs). Each is expressed as a percentage. Margin is not the same as markup, and a good margin depends entirely on your industry. This guide gives every formula with a worked example, a benchmark table, and insights on how to improve your margins.
The margin formula is one of the most useful tools in business finance, and one of the most muddled, because there are several margins and people mix them up. A margin tells you what share of your revenue survives as profit after a particular set of costs. Track the right one, and you know whether a product, a price, or a whole business actually makes money. Track the wrong one, or none at all, and you can grow revenue for years while quietly losing money on every sale.
There is a lot of room to get this wrong. About 40% of small business owners do not track their margins against benchmarks, per US Census data cited by Crestmont Capital, which means they are flying blind on profitability, growing revenue without knowing whether each sale actually contributes to profit. This guide walks through each margin formula with a worked example, explains margin versus markup, gives an industry benchmark table, and covers how to improve your margins. None of the math is hard; the value is in knowing which margin answers which question. Start with the basics.
What is a margin?
A margin is profit expressed as a percentage of revenue. It answers a simple question: for every dollar of sales, how many cents do you keep after a given set of costs? A 30% margin means thirty cents of every dollar is profit at that stage, and seventy cents went to costs. That framing is what makes margin so useful: it turns messy absolute numbers into a rate you can compare against last quarter, a competitor, or an industry benchmark. Because it is a percentage, margin lets you compare profitability across products, periods, and companies of very different sizes, which raw profit in dollars cannot. A company earning a million dollars in profit sounds healthy until you learn it did so on a hundred million in sales, a 1% margin that leaves almost no room for error. Margins ultimately determine how much a company can reinvest in growth and in the customer lifetime value that sustains it.
The key thing to grasp is that there is no single margin. There are several, each subtracting a different set of costs, and each answering a different question. Think of them as a series of filters: revenue enters at the top, and each margin strips away one more layer of cost to reveal a cleaner picture of profitability. Gross margin looks at production costs, operating margin adds running costs, and net margin accounts for everything. Understanding which is which is the whole game, because a business can have a healthy gross margin and still lose money once overhead is counted. Take them in order, starting with gross margin.
Gross margin formula
Gross margin, or gross profit margin, measures what you keep after the direct cost of making your product or delivering your service. It is the first and broadest margin, and the starting point for every calculation that follows.
Gross margin % = (Revenue – COGS) / Revenue x 100
COGS is the cost of goods sold: the direct costs of producing what you sell, such as raw materials, the labor that makes the product, and the components that go into it. For a service business, the equivalent is the direct cost of delivering the service, such as the wages of the people doing the billable work. It excludes overhead like rent, salaries outside production, and marketing, which belong to later margins. The line between a direct cost and an overhead cost is where a lot of accounting judgment lives, so consistency matters more than getting every edge case perfect. What matters is that you apply the same definition every period, so your margins are comparable over time.
Worked example. A company with $500,000 in revenue and $300,000 in COGS has a gross profit of $200,000. Its gross margin is ($500,000 – $300,000) / $500,000 x 100, which equals 40%. For context, the average gross margin across industries is about 36.6%, per NYU Stern data summarized by Vena, though the figure ranges from single digits in some sectors to over 80% in software. A healthy gross margin is the foundation of everything else, because it is the pool of money left to cover every other cost and still leave a profit. If gross margin is thin, no amount of cost-cutting elsewhere will save the business. A 40% gross margin means the company keeps forty cents of every sales dollar to cover everything else and still profit. Gross margin tells you whether the core product is profitable before overhead; the next margin adds that overhead in.
Operating margin formula
Operating margin measures what you keep after both production costs and operating expenses, such as rent, salaries, and marketing. Where gross margin looks only at making the product, operating margin looks at running the whole business. It shows how profitable the business is from its core operations, before interest and taxes, and it is sometimes called the operating profit margin or EBIT margin. This is the number that reflects how well management actually runs the company, since it captures the costs leaders control day to day, from staffing to marketing spend. A rising operating margin usually signals a business getting more efficient as it grows.
Operating margin % = Operating income / Revenue x 100 (Operating income = Revenue – COGS – operating expenses)
Worked example. Take the same company: $500,000 revenue, $300,000 COGS, and $120,000 in operating expenses. Operating income is $80,000, so the operating margin is $80,000 / $500,000 x 100, which equals 16%. Operating margin is often the fairest way to compare two companies in the same industry, because it strips out financing and tax choices and shows how well each runs its actual operations. Two firms with identical products can post very different operating margins purely because one controls its overhead better than the other. That is why investors watch operating margin closely as a measure of management quality. Once you subtract everything else, you reach the bottom line.
Net profit margin formula
Net profit margin, or simply net margin, is the bottom line. It measures what you keep after every cost the business incurs: production, operations, interest on debt, and taxes. It is the margin most people mean when they say profit margin, and it is the one reported to shareholders. Because it includes one-time items like a lawsuit settlement or a tax windfall, a single year’s net margin can be misleading, which is why analysts often look at the trend across several years.
Net profit margin % = Net income / Revenue x 100
Worked example. If that company pays $15,000 in interest and $15,000 in taxes, the net income is $50,000. Net margin is $50,000 / $500,000 x 100, which equals 10%. That is close to typical: the average net margin across industries is about 8.5%, and the S&P 500 blended net margin sits around 10.7%, per figures compiled by Harvest. A single company can swing well above or below that in any given year, so one year in isolation says less than a steady trend. Net margin is the headline number, and it is what ultimately determines how much a company can reinvest or return to owners. But for day-to-day pricing decisions, a fourth margin is often more useful.
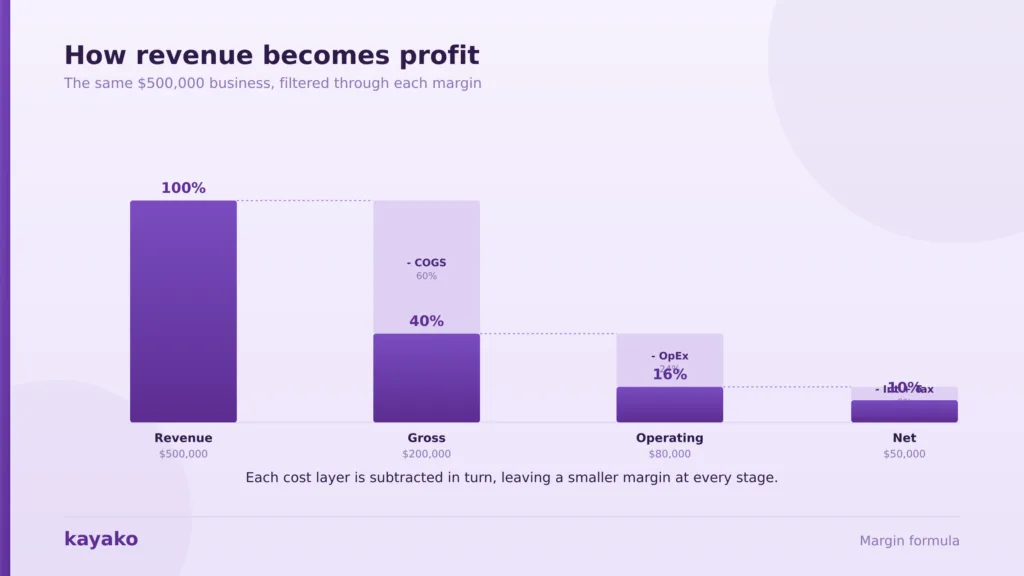
Revenue filtered through each margin: gross, then operating, then net.
Contribution margin formula
Contribution margin measures what each sale contributes toward covering fixed costs and profit, after variable costs. Unlike the other three margins, which look at the whole business, contribution margin zooms in on a single product or unit. It is essential for pricing and break-even decisions because it isolates the costs that change with each unit sold from the fixed costs that do not. Variable costs rise and fall with volume, like materials and shipping, while fixed costs like rent stay the same whether you sell ten units or ten thousand.
Contribution margin = Revenue – Variable costs Per unit: Price – Variable cost per unit. As a %: (Price – Variable cost) / Price x 100
Worked example. Say a product sells for $50 with $30 in variable costs per unit. Its contribution margin is $20 per unit, or 40% as a percentage. A useful way to read it is that the first $30 of every sale just replaces the cost of making the unit, and everything above that is a contribution. That $20 is what each sale contributes toward fixed costs and profit, which is exactly what you need to work out how many units you must sell to break even. If fixed costs are $10,000 a month, you divide that by the $20 contribution to see that you need 500 units a month just to cover them. The higher the contribution margin, the fewer units you need to sell to cover your fixed costs and start making a profit, which is why it sits at the heart of any break-even analysis. Contribution margin is about individual units; a common confusion is mixing margin up with markup, which is worth clearing up.
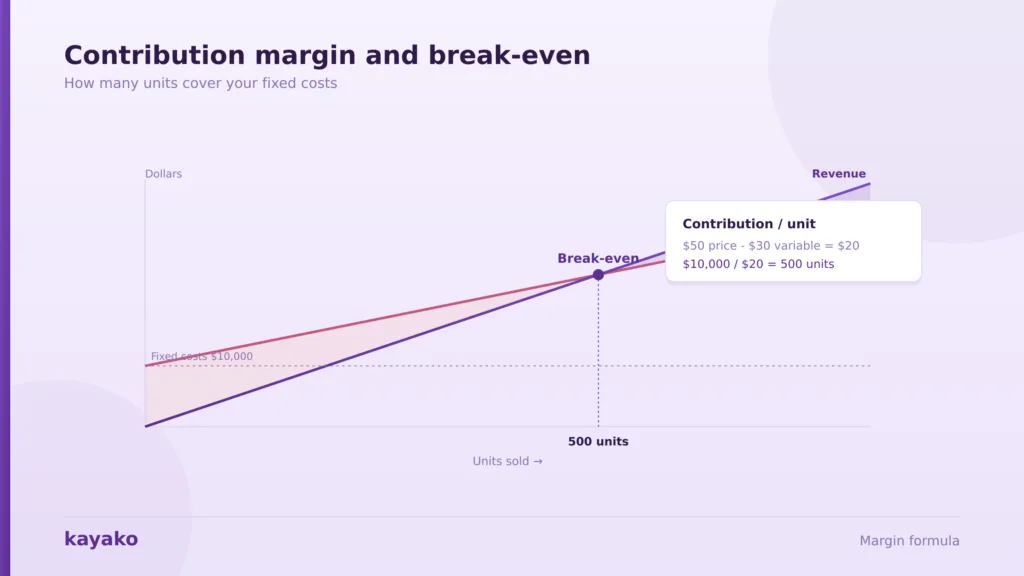
Contribution margin per unit and the break-even point in units.
Margin vs markup
Margin and markup use the same two numbers, price and cost, but they are not the same, and confusing them leads to underpricing. Margin is profit as a percentage of the selling price. Markup is profit as a percentage of the cost. Because the cost is always a smaller number than the price, the markup percentage is always larger than the margin percentage for the same item, which is exactly where the confusion comes from.
Margin % = (Price – Cost) / Price x 100 Markup % = (Price – Cost) / Cost x 100
Worked example. An item costs $60 and sells for $100. The margin is ($100 – $60) / $100, which is 40%. The markup is ($100 – $60) / $60, which is about 67%. Same item, two very different numbers, because one is measured against the $100 price and the other against the $60 cost. If you set prices using markup but report profitability using margin, you can badly misjudge how much you actually make, so always be clear which one you mean. A retailer who applies a 50% markup, for instance, is really earning only a 33% margin, and confusing the two is a common way businesses accidentally underprice. With the formulas covered, the natural question is what counts as a good margin.
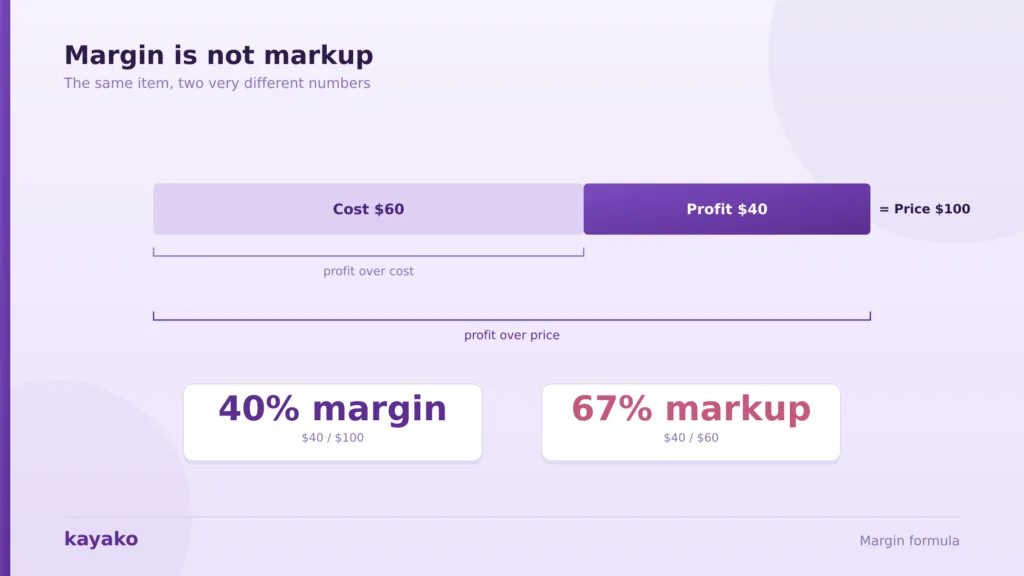
The same item is measured against price (margin) and against cost (markup).
What is a good margin? Industry benchmarks
There is no universal good margin, because margins vary enormously by industry. A grocery store and a software company are not playing the same game, so comparing their net margins tells you nothing useful. What looks like a poor margin in one industry can be excellent in another. The most reliable public benchmarks come from NYU Stern professor Aswath Damodaran’s margin dataset, which tracks operating and net margins by sector and is updated annually. It is the source most finance teams quietly rely on when they want a defensible benchmark.
The table below shows typical ranges by industry. Use it to judge your own margins against your sector, not against a round number pulled from a headline. A 5% net margin is alarming for a software firm and excellent for a grocer.
| Industry | Typical gross margin | Typical net margin |
|---|---|---|
| Software and SaaS | 70% to 90% | 15% to 25% |
| Professional services | 30% to 50% | 8% to 15% |
| Manufacturing | 25% to 35% | 5% to 10% |
| Retail (general) | 20% to 30% | 2% to 5% |
| Restaurants | around 65% | around 4% |
| Grocery | around 25% | 1% to 3% |
| All-industry average | about 36.6% | about 8.5% |
Software carries high margins because the cost of serving one more customer is tiny, while grocery runs on razor-thin net margins and makes money on volume, per benchmark figures from Bluevine. Low-margin, high-volume businesses are especially exposed to customer churn, since they depend on repeat purchases to make the model work. This is also why fast-growing software companies are often judged on a rule of thumb that balances growth and margin rather than on profit alone.
The takeaway is to compare within your industry and against your own history, rather than against a headline average. A margin trending up year over year is often a better sign than a high margin standing still, because it shows the business is getting more efficient rather than resting on an advantage that competitors may erode. Knowing where you stand is the first step; the next is improving it.
How to improve your margins
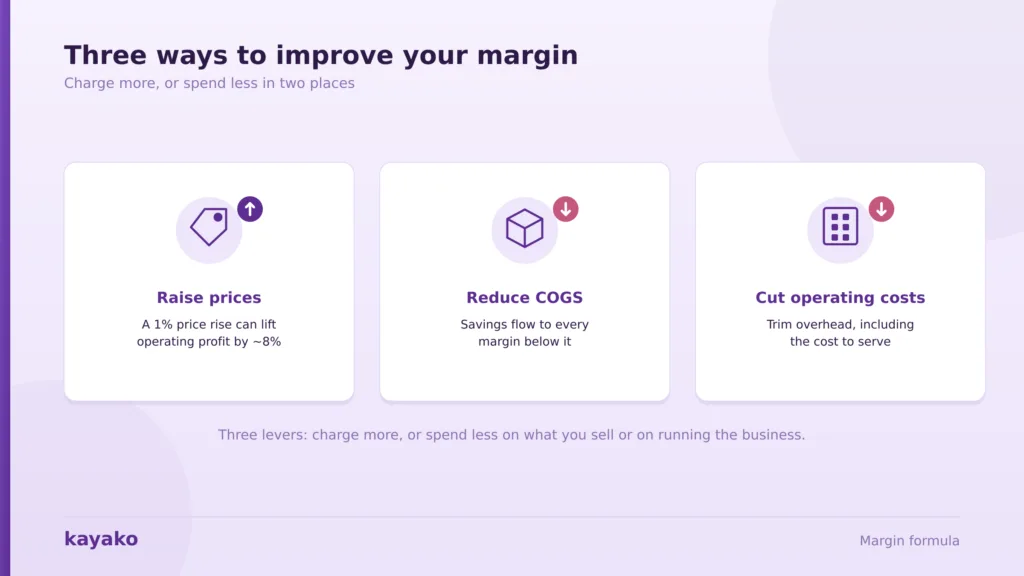
Margins improve in three broad ways: charge more, spend less on what you sell, or spend less on running the business. Each maps to a lever, and the biggest gains usually come from pricing, because a price change costs almost nothing to make yet flows straight to profit.
- Raise prices or improve mix. Even a small price increase flows almost entirely to the bottom line, since the extra revenue carries little added cost. The hard part is confidence, not arithmetic: many businesses undercharge simply because they never tested a higher price. Widely cited McKinsey pricing research has found that a 1% improvement in price can lift operating profit by roughly 8% on average, which makes pricing one of the most powerful margin levers available. Shifting sales toward higher-margin products lifts the blended margin in the same way.
- Reduce COGS. Negotiate with suppliers, cut waste, and improve efficiency in production to widen gross margin. Because COGS sits at the very top of the calculation, a saving here flows through to every margin below it, from gross all the way to net. A supplier discount is not a one-time win; it improves profitability on every future sale.
- Cut operating costs. Lower the overhead that sits between gross and net margin, from rent to the cost of running support and service. Overhead is often where the easiest wins hide, because it accumulates quietly and rarely gets the scrutiny that production costs do. Tracking the right support metrics is one practical way to see where that overhead is going.
The three levers that move a margin: price, cost of goods, and operating costs.
That last lever is where a support platform quietly matters to margin, and it is the one honest place this finance topic touches Kayako. Support labor and contact volume sit in operating costs, so a high cost to serve drags down operating and net margin. Reducing it through automation and self-service protects the bottom line, since each contact deflected or resolved automatically is a cost that never lands in operating expenses. As support volume grows with the business, a lower cost per contact is what keeps operating margin from eroding. That is the core idea behind customer support cost reduction. Because retained customers cost far less to serve than newly acquired ones, improving retention and lifting customer lifetime value both support healthier margins over time.
Turn support from a cost center into a margin lever, with Kayako
The point is not that a support tool is a finance tool; it is not. It is that cost to serve is a real line in operating expenses, and the same automation that speeds up support also lowers that cost. For a business watching its operating margin, that connection is worth understanding. Support is rarely the first place a finance team looks for margin, yet for any company with meaningful service volume, it can be a real one. With the levers clear, a quick recap ties it together.
The margin formula is really four formulas, each answering a different question. Gross margin shows whether your product is profitable before overhead, operating margin shows how well the business runs, net margin is the true bottom line, and contribution margin drives pricing and break-even decisions. Keep margin and markup straight, and always judge a margin against your own industry rather than a universal number.
Once you can calculate all four, you can find where profit leaks and act on it, whether that means raising prices, cutting the cost of goods, or trimming the operating costs that sit between revenue and net profit. The margins even guide where to look: a weak gross margin points to pricing or production, while a healthy gross margin but weak net margin points to overhead. Margins are not just a reporting exercise; they are the clearest signal of whether the business is actually working. Revenue tells you how big you are, but margin tells you how healthy you are, and a growing company with shrinking margins is often heading for trouble that the top line hides.
Frequently asked questions
What is the margin formula?
The general margin formula is profit divided by revenue, multiplied by 100 to express it as a percentage. Which profit you use defines the margin: gross margin uses revenue minus COGS, operating margin uses operating income, and net margin uses net income. So gross margin is (Revenue minus COGS) divided by Revenue times 100, and net margin is Net income divided by Revenue times 100. Each margin subtracts a different set of costs and answers a different question about profitability.
What is the difference between gross, operating, and net margin?
The three margins differ by which costs they subtract. Gross margin subtracts only the direct cost of goods sold, showing whether the core product is profitable. Operating margin also subtracts operating expenses like rent, salaries, and marketing, showing how well the business runs its operations. Net margin subtracts everything, including interest and taxes, giving the true bottom-line profitability. Gross margin is the broadest, net margin the narrowest, and operating margin sits in between.
What is the difference between margin and markup?
Margin and markup use the same price and cost but calculate against different bases. Margin is profit as a percentage of the selling price: (Price minus Cost) divided by Price. Markup is profit as a percentage of the cost: (Price minus Cost) divided by Cost. For an item that costs $60 and sells for $100, the margin is 40%, but the markup is about 67%. Confusing the two leads to underpricing, so always be clear which one you are using.
What is a good profit margin?
A good profit margin depends heavily on your industry. As a rough guide, a net margin of around 10% is often considered average, 20% is strong, and 5% is low, but these vary widely by sector. Software companies routinely post net margins above 15%, while grocery stores operate on 1% to 3% and make money on volume. The most useful comparison is against benchmarks for your own industry, such as the NYU Stern dataset, rather than against a single universal figure.
How do you calculate net profit margin?
Net profit margin is net income divided by total revenue, multiplied by 100. Net income is what remains after all costs are subtracted from revenue, including COGS, operating expenses, interest, and taxes. For example, a company with $500,000 in revenue and $50,000 in net income has a net margin of 10%. It is the most comprehensive margin because it accounts for every cost, which is why it is the figure most often quoted as a company’s profit margin.