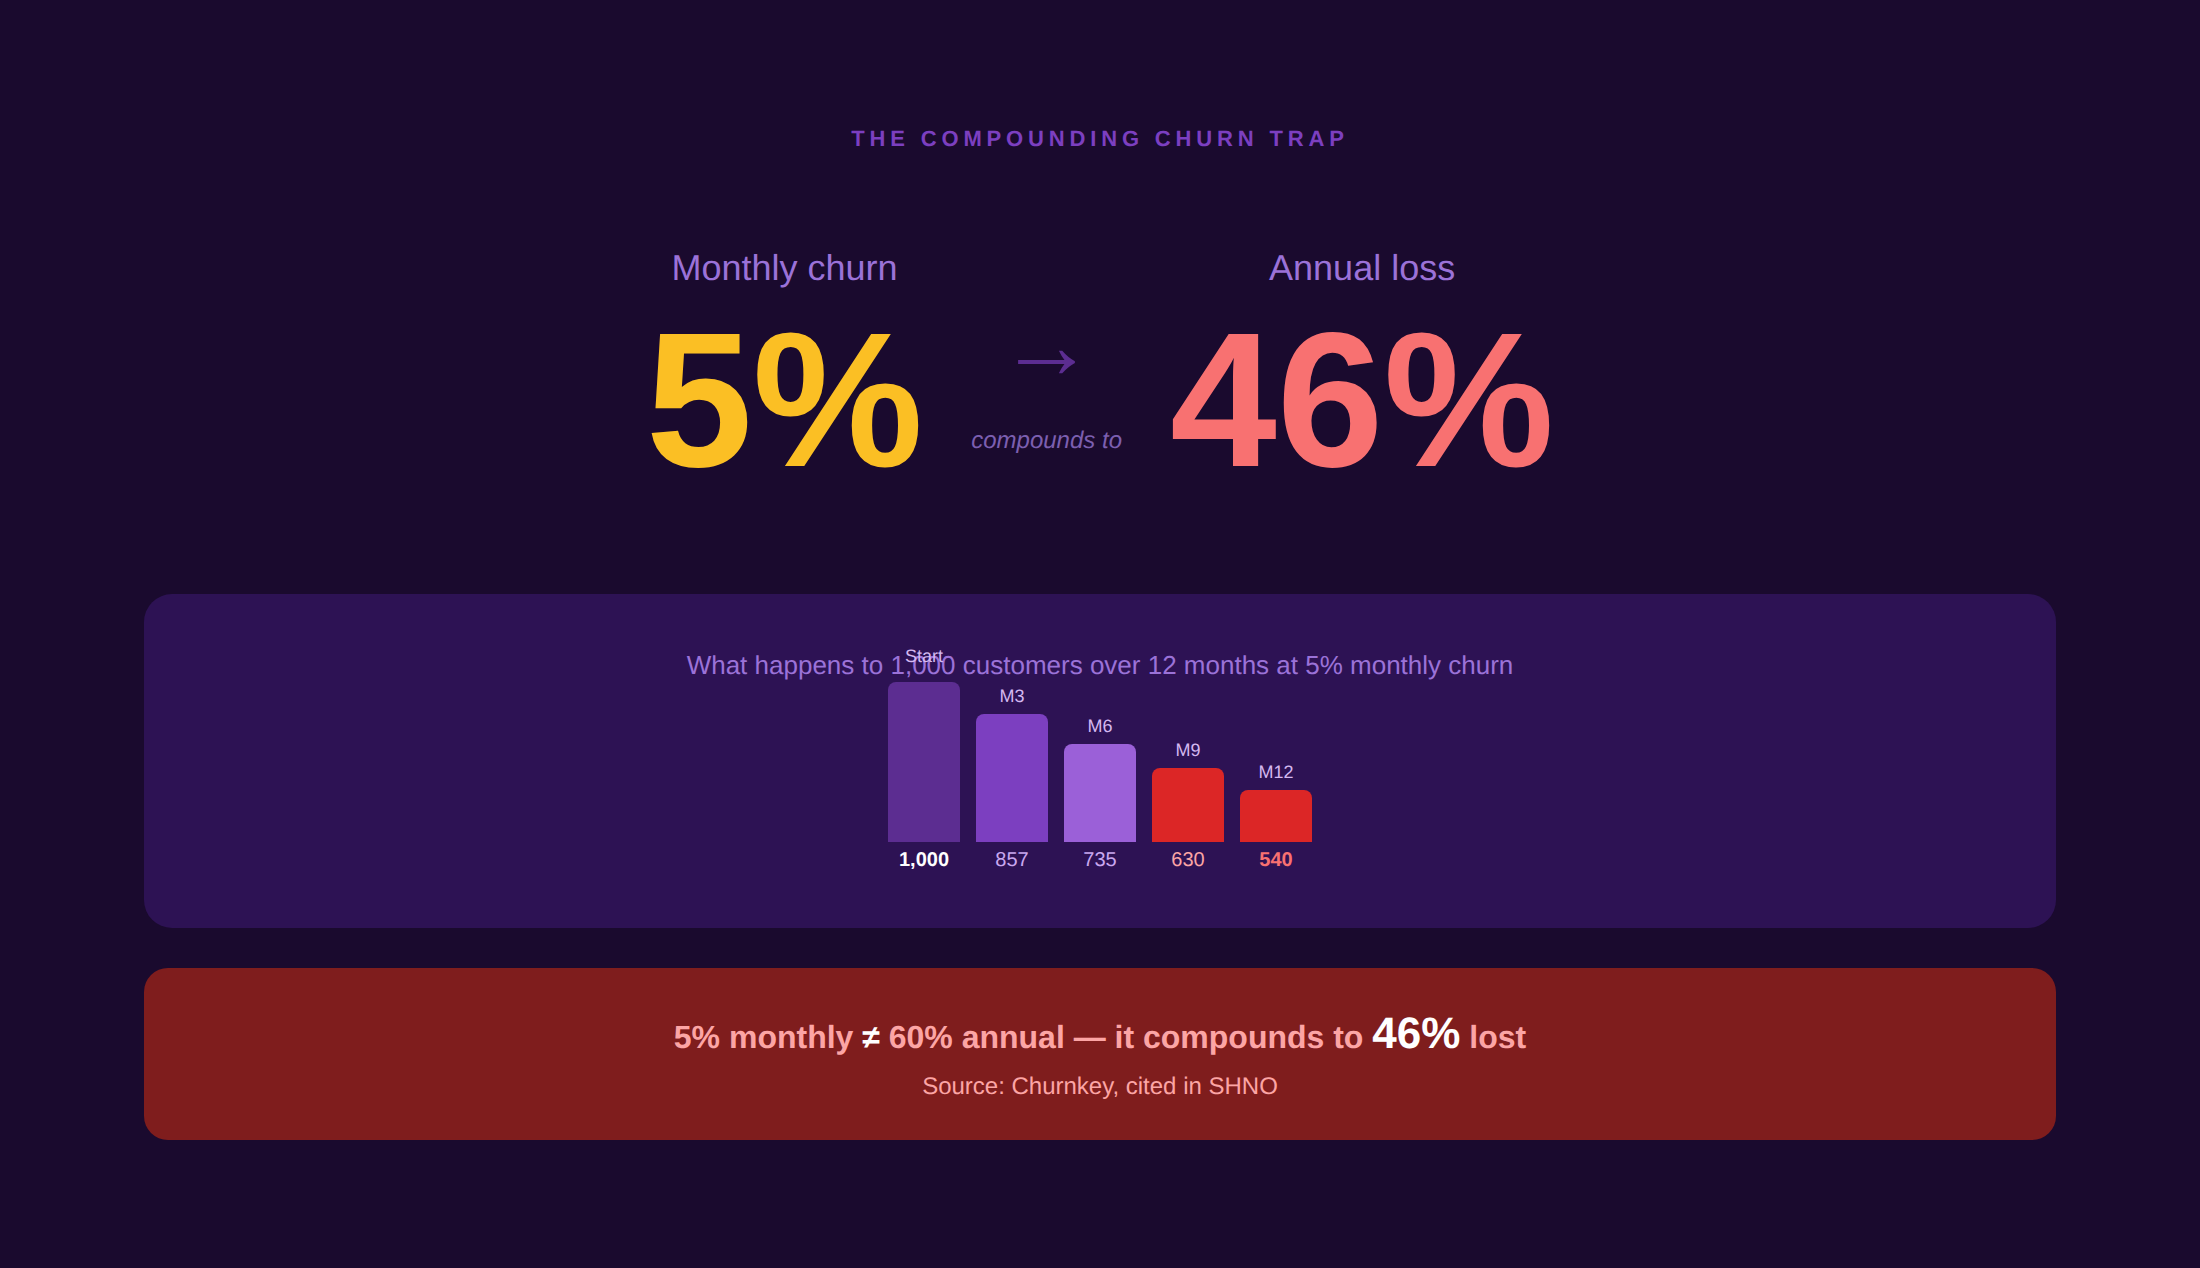
A 5% monthly churn rate sounds manageable until you do the math: a monthly churn rate of just 5% results in losing 46% of your customers annually (Churnkey, cited in SHNO). And a 10% monthly rate loses more than 70% of the customer base in twelve months, forcing the entire business onto a treadmill of replacement acquisition just to stand still.
Customer churn rate is the metric that sits beneath almost every other growth number. It suppresses CLV, inflates CAC payback periods, compresses NRR, and destroys the compounding that makes subscription businesses valuable. This guide covers how to measure it correctly, what the benchmarks actually mean in 2026, why customers churn, how to predict it before it happens, and the proven levers that reduce it.
What Is Customer Churn Rate?
Customer churn rate is the percentage of customers who cancel or do not renew their relationship with a business over a defined time period. It is the inverse of retention: a 90% retention rate equals a 10% churn rate. The terms churn, attrition, and cancellation rate are often used interchangeably, though attrition is more common in telecoms and financial services, while churn dominates SaaS and subscription contexts.
Churn matters more than almost any other metric in a subscription business because of its compounding nature. Lost customers do not just stop generating revenue today; they eliminate every future contract, expansion, referral, and case study they would have generated. A customer who churns in month three of a five-year expected relationship eliminates 57 months of potential revenue from your forecast.
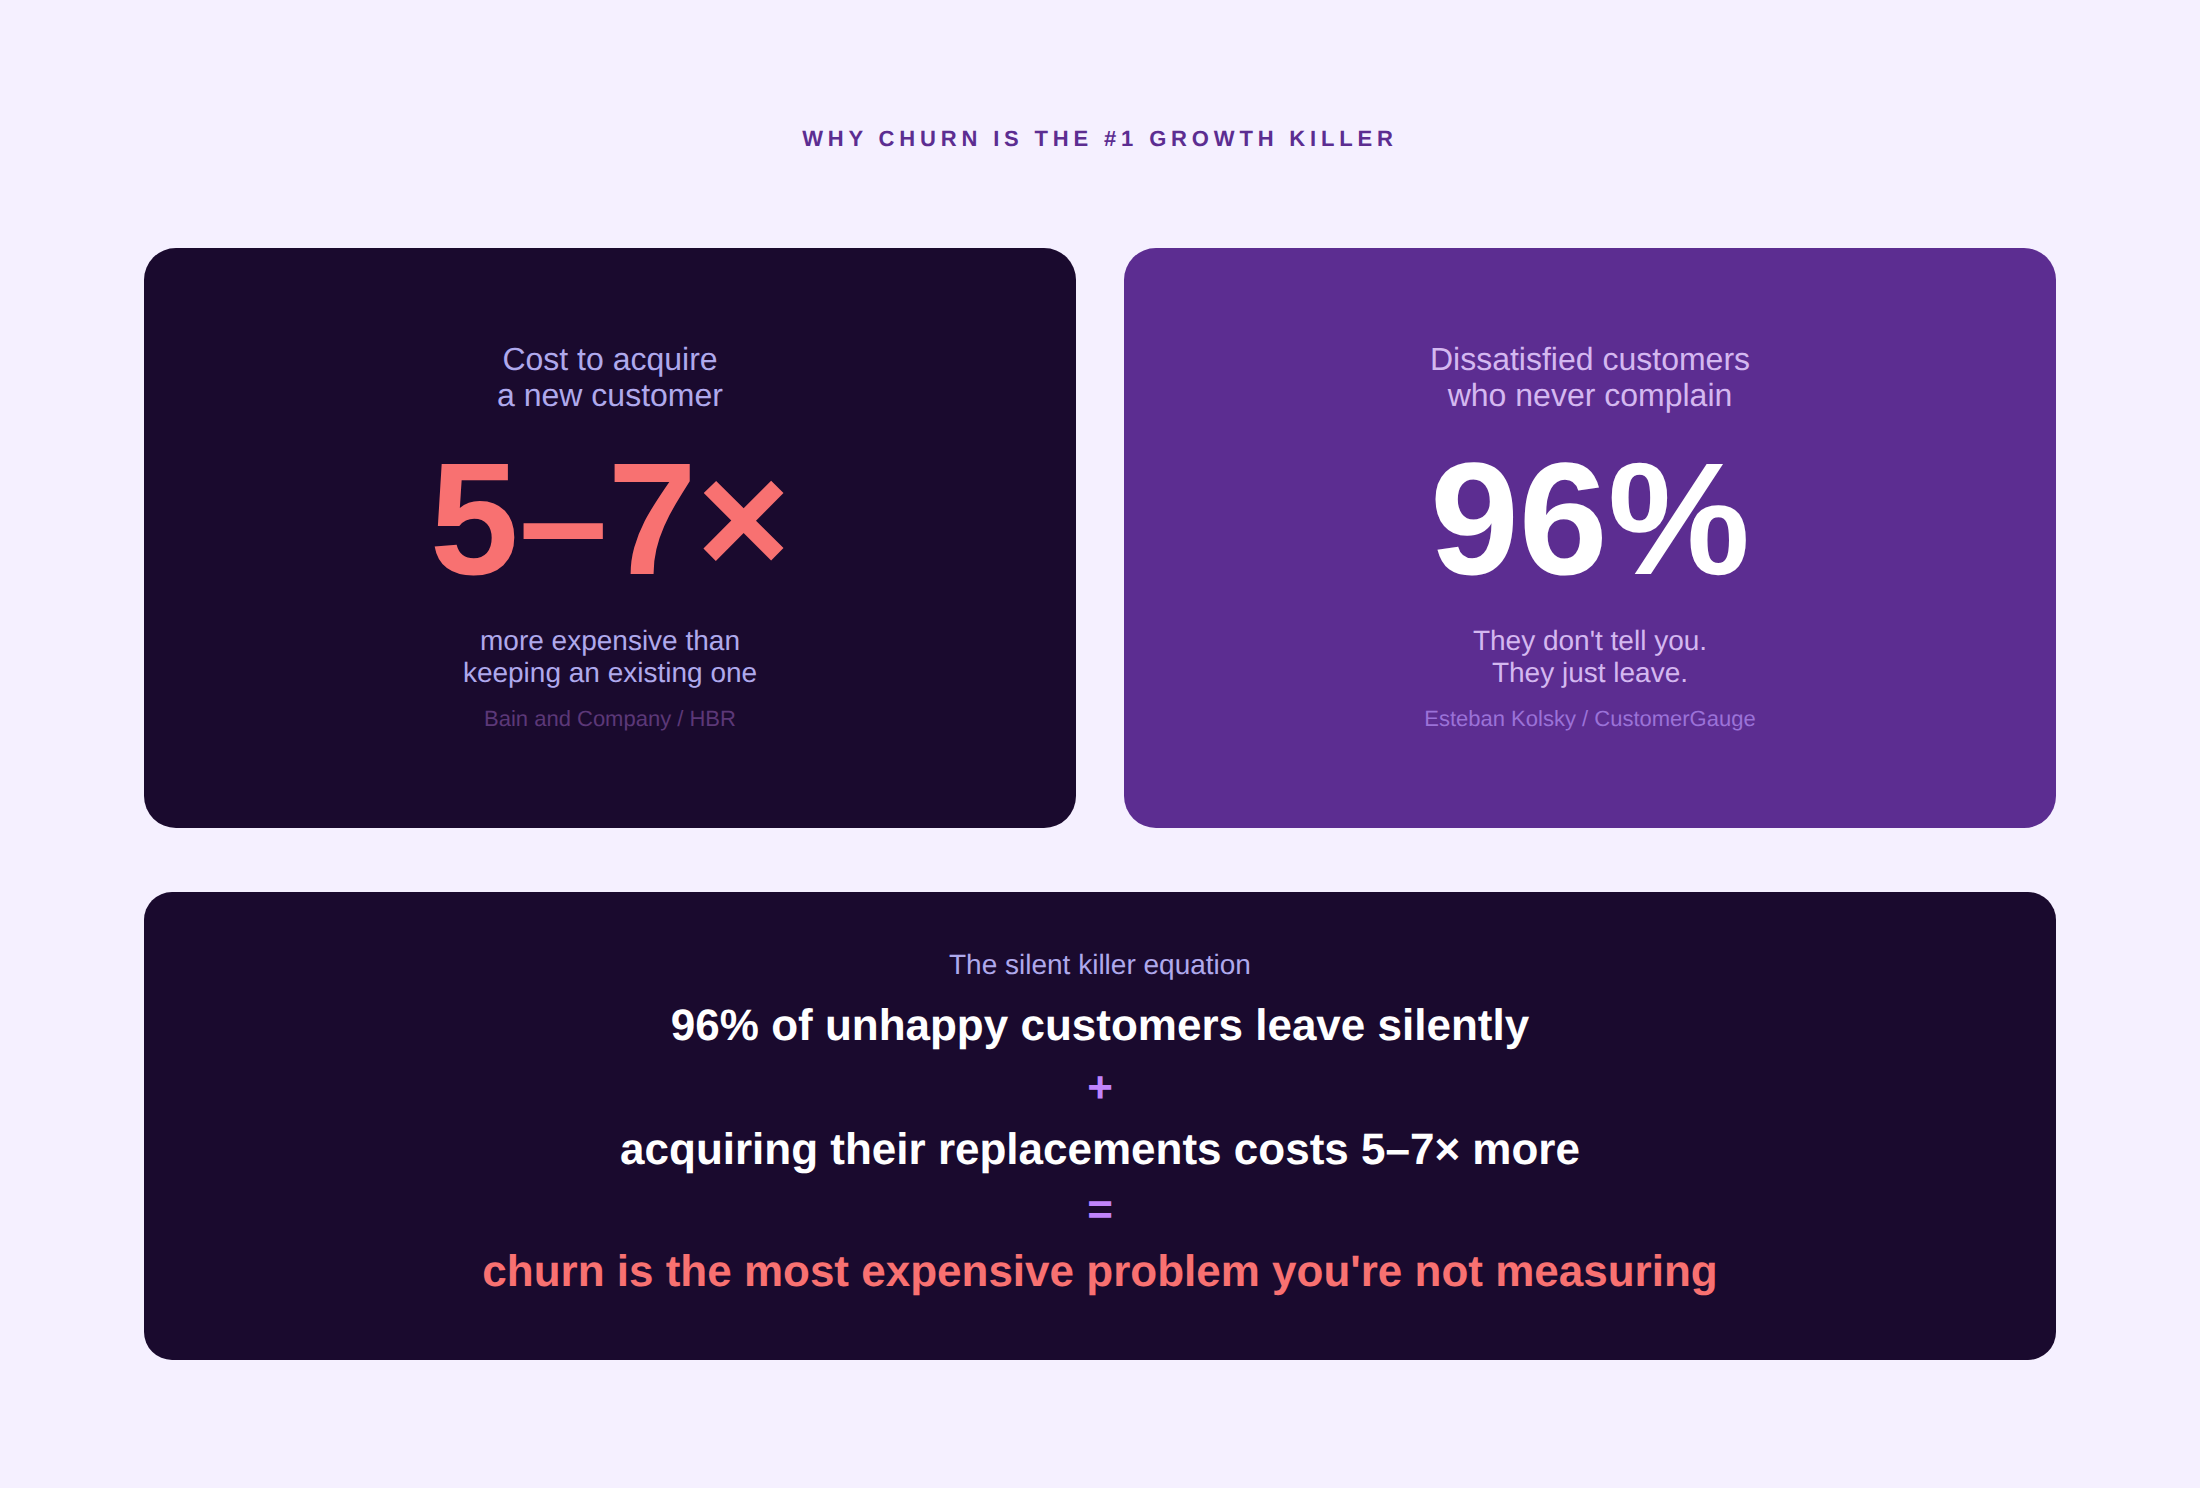
Acquiring a new customer costs five to seven times more than retaining an existing one. That cost differential is why churn prevention is not just a customer success activity. It is a unit economics problem that every part of the business must be designed around.
Customer Churn Rate Formula and How to Calculate It
The standard formula
Churn Rate = (Customers Lost in Period / Customers at Start of Period) x 100
This gives you the percentage of your starting customer base that did not make it to the end of the period.
Monthly churn worked example
Customers at start of month: 1,000
Customers who canceled during the month: 35
New customers acquired during the month: 80 (excluded from the calculation)
Monthly Churn Rate = (35 / 1,000) x 100 = 3.5%
Note: New customers acquired during the period are excluded.
Churn measures what happened to the cohort that existed at the start.
Annualizing from monthly churn
Monthly churn does not multiply by 12 to get annual churn. It compounds. The formula for annual churn from a known monthly rate is:
Annual Churn = 1 – (1 – Monthly Churn Rate)^12
At 3% monthly churn: Annual Churn = 1 – (0.97)^12 = 1 – 0.694 = 30.6% annually. The compounding effect is why monthly churn rates that appear small produce large annual losses.
Cohort-based churn
Standard churn formulas measure the whole customer base at a point in time. Cohort-based churn follows a specific group of customers acquired in the same period and tracks their retention curve over time. Cohort analysis reveals how retention changes between customer acquisition vintages, whether newer cohorts are healthier than older ones, and where in the lifecycle churn concentrates. It is the most diagnostic form of churn analysis available, and the one most likely to surface the specific interventions that will actually move the number.
Customer Churn vs. Revenue Churn: Four Variants You Need to Know
The four variants
Churn comes in four distinct variants, each telling a different story. Conflating them produces misleading analysis and wrong interventions.
| Metric | What it measures | Can exceed 100%? | Primary use |
| Gross customer churn | % of customers who left | No | Logo retention health |
| Net customer churn | Logo losses minus new logos | No | Overall headcount growth |
| Gross revenue churn | MRR lost to churn and contraction | No (max 100%) | Revenue retention floor (GRR) |
| Net revenue churn | Revenue lost minus expansion from the existing base | Yes (negative = NRR above 100%) | True revenue health (NRR) |
Why the distinction matters in practice
A company can have 10% gross customer churn (many customers leaving) but negative net revenue churn if the remaining customers expand their spend enough to cover the losses. Conversely, a company with 2% gross customer churn can have severe revenue churn if the churned customers were disproportionately large accounts. Always specify which variant you are reporting, especially in investor conversations where the terms are frequently used imprecisely.
Gross Revenue Retention (GRR), which captures only churn and contraction without expansion, is the metric investors use to assess the floor of a business. Net Revenue Retention (NRR), which includes expansion, is the ceiling. See the full relationship between churn and net revenue retention for how these metrics interact at the portfolio level.
Voluntary vs. Involuntary Churn: The Split That Changes Your Strategy
Voluntary churn
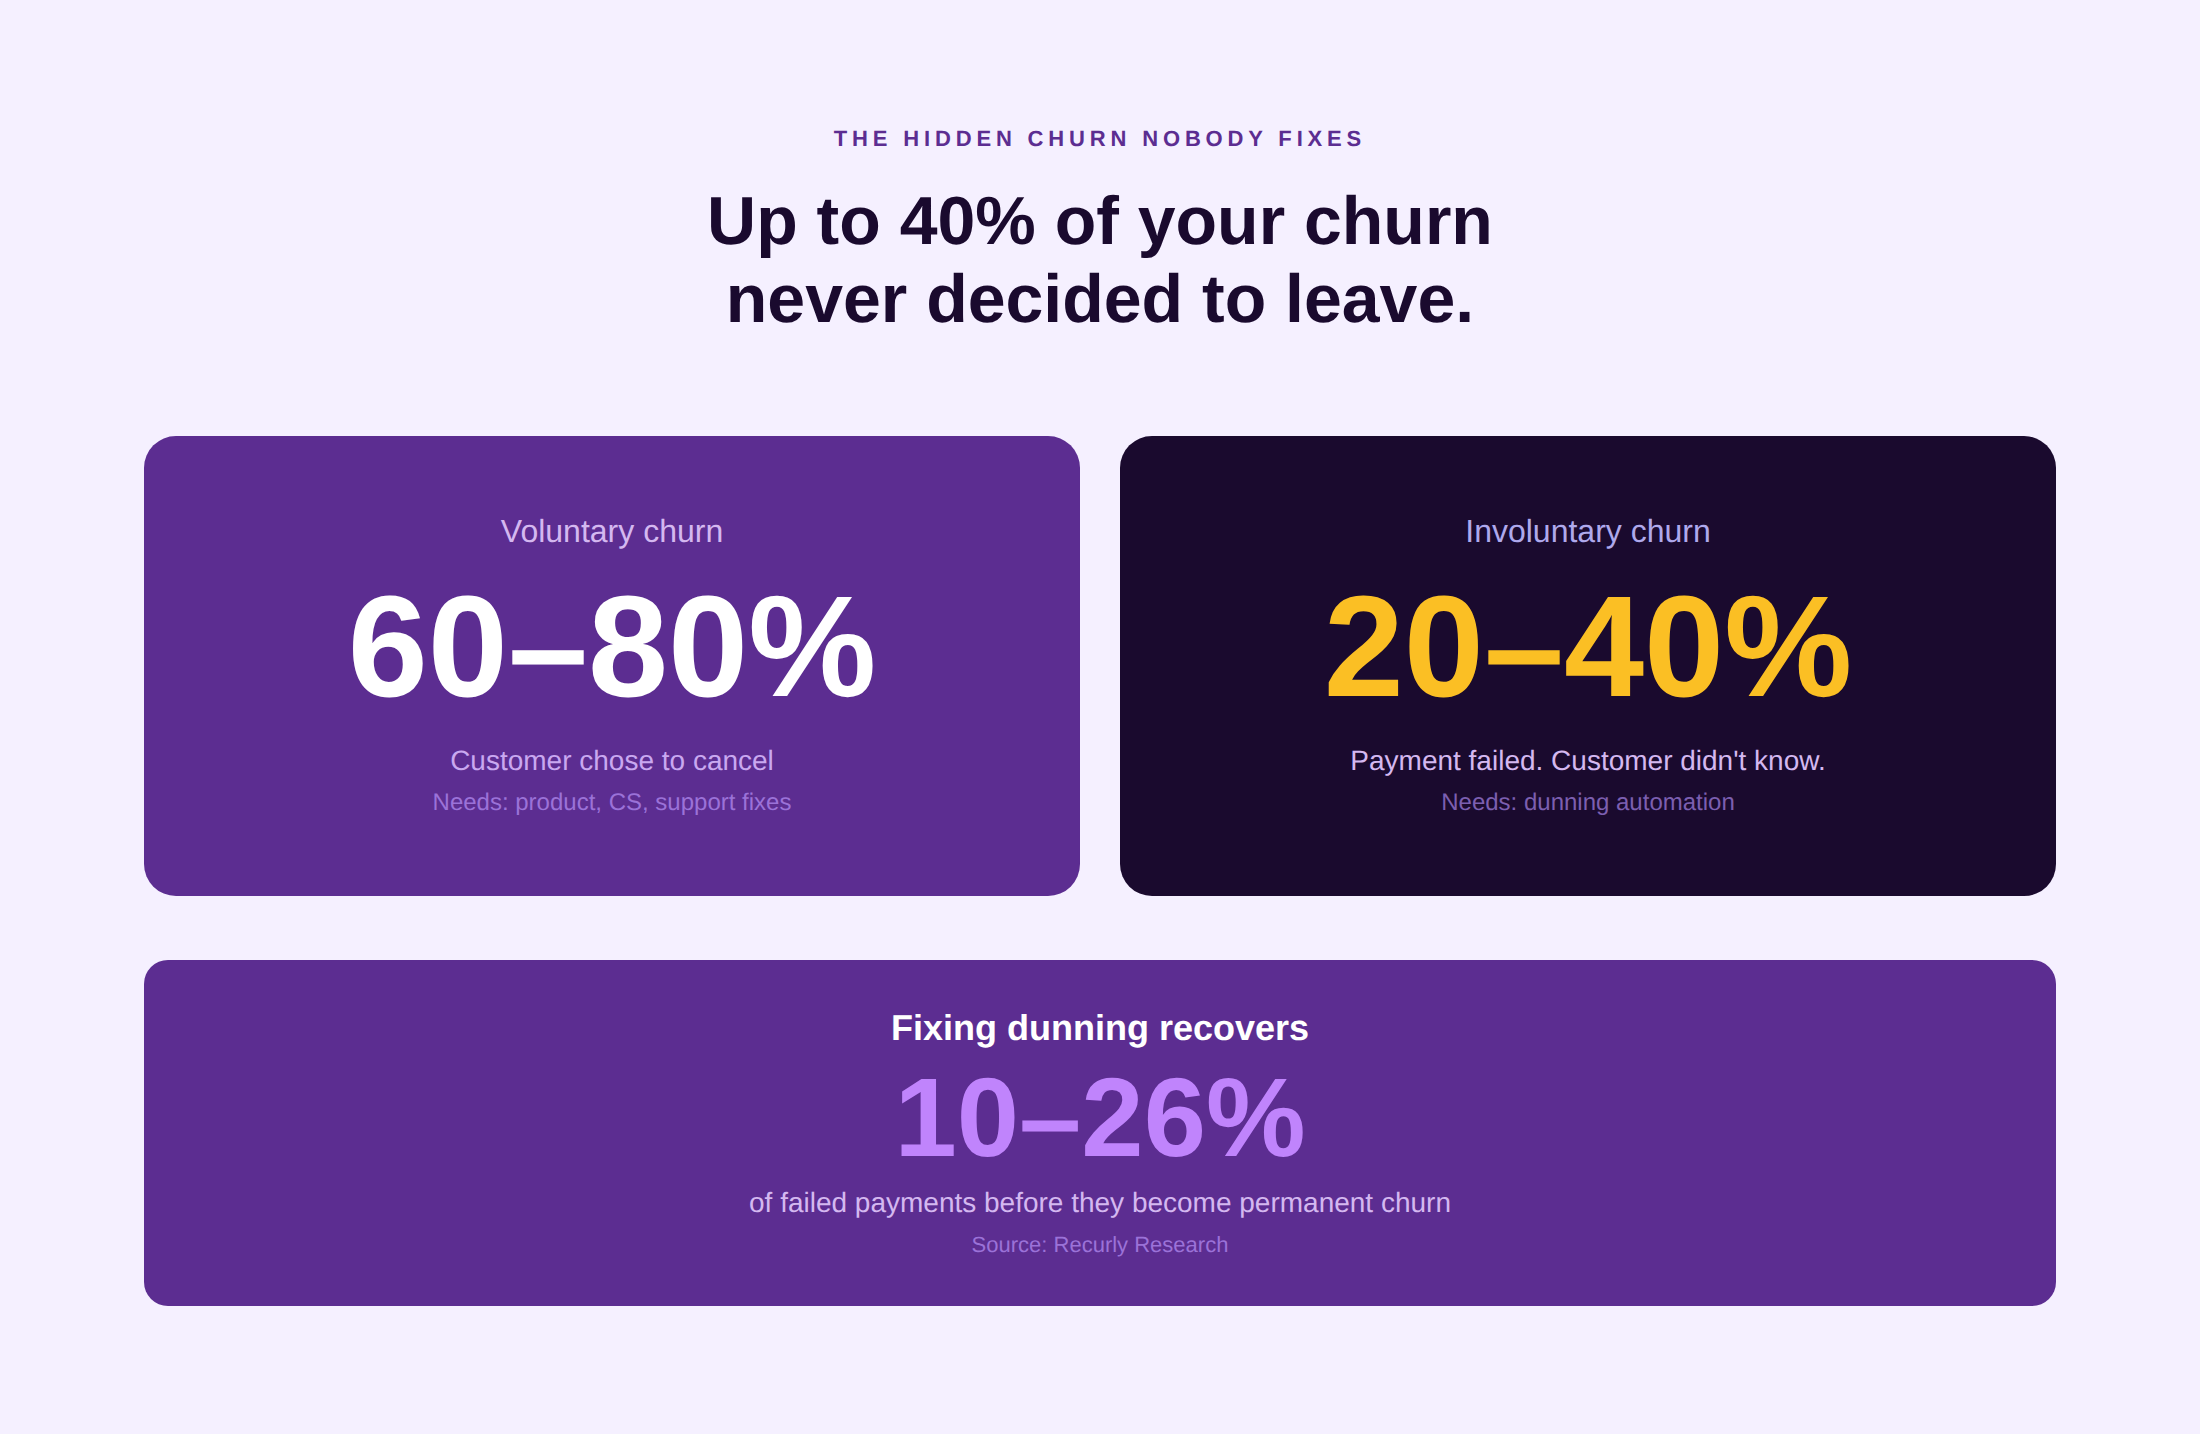
Voluntary churn is customer-initiated: the customer actively decides to cancel, downgrade, or not renew. It signals a product-market or value delivery problem. The causes include unresolved support issues, missing features, competitive displacement, or pricing perception. Voluntary churn requires product, CS, and support interventions.
Involuntary churn
Involuntary churn is payment-initiated: the customer did not choose to leave, but their subscription was terminated due to a failed payment, expired credit card, or insufficient funds. The customer often does not know they have churned.
Involuntary churn accounts for 20 to 40% of total churn in most subscription businesses. It is found that B2B SaaS involuntary churn ran at 0.8% of total churn, against 2.6% voluntary. In consumer subscription, the proportion is often higher because annual contract lock-ins are less common, and payment failure rates correlate with income volatility.
Involuntary churn is recoverable through dunning management: automated retry logic, pre-expiry card update reminders, and in-app prompts that give customers a frictionless path to updating their payment information before the subscription terminates. The key insight: involuntary churners did not decide to leave, which means their willingness to stay is high if you can keep them active through the payment failure.
Kayako helps support teams identify at-risk accounts early by surfacing friction signals before they become cancellations. See How It Works
What Is a Good Customer Churn Rate? Benchmarks by Segment
The general SaaS benchmark
The median B2B SaaS annual churn rate is 3.5%, consisting of 2.6% voluntary and 0.8% involuntary churn (Recurly Churn Report, analyzed by Vitally). For established B2B SaaS companies, an annual logo churn rate below 5% is considered a solid footing. Consumer-facing SaaS typically runs 6.5 to 8% annually due to shorter contract durations, lower switching costs, and higher price sensitivity.
By customer segment
| Segment | Typical annual churn | Key driver |
| Enterprise SaaS (multi-year contracts) | Below 5% annually | Deep integrations, multi-year contracts |
| Mid-market SaaS | 5-8% annually | Renewal risk at annual contract date |
| SMB-focused SaaS | 8-15% annually | Customer business failure rate ~20% |
| Consumer subscription (DTC) | 10-20% annually | Low switching cost, price sensitivity |
| E-commerce subscriptions | 8.2% monthly (Baremetrics) | Perceived switching cost near zero |
| Infrastructure/platform SaaS | 1.8% monthly (lowest vertical) | Technical integration depth |
| Financial services (banking, EHR) | 1-2% monthly | Data migration cost, regulatory friction |
Sources: Recurly Churn Report, Baremetrics Open Benchmarks, RetentionCheck 2026, Focus Digital SaaS Churn Report
Stage matters as much as segment: seed-stage SaaS annual logo retention runs 80 to 85%, while pre-IPO companies reach 95 to 98% (RetentionCheck). The difference is explained by product-market fit maturity, CS investment, and contract structure rather than product category alone.
The Most Common Causes of Customer Churn
Poor onboarding
Customers who do not reach their first value milestone within 30 days are disproportionately likely to churn before their first renewal. Onboarding failure does not announce itself: the customer simply does not return after the first week. Monitoring time-to-first-value by cohort is the most reliable way to identify onboarding gaps before they appear in churn data.
Missing value moments
Value moments are the specific product interactions that correlate with long-term retention: a report run, an integration activated, a team member invited, a workflow automated. Customers who reach these moments stay; customers who do not, leave. Identifying your product’s value moments through cohort analysis and then engineering the onboarding path to reach them faster is one of the highest-leverage churn reduction interventions available.
Poor customer support quality
Unresolved or slow support is a silent churn driver. Customers rarely say, “I left because your support was slow”; they say “the product wasn’t right for us.” But support interaction data tells a different story: accounts with high ticket volumes and low CSAT scores are significantly more likely to churn at renewal. 96% of dissatisfied customers do not complain, they simply leave. That means the CSAT trend at the account level is the signal, not the explicit complaint.
Pricing perception
Customers who feel they are paying more than the value they receive are chronically at-risk, even when their usage is high. Pricing perception is distinct from price level: a customer can pay $10,000 per month and feel great value, or pay $100 and feel overcharged. The levers are visibility into value delivered (business review data, usage reports, ROI calculations) rather than discounting, which devalues the product and trains customers to expect concessions at every renewal.
Competitive displacement
When a competitor offers a credible alternative at a lower price or with a feature the customer needs, the switching conversation begins. The correct response is not matching the competitor’s price but understanding which specific feature gap or outcome gap makes the alternative credible. If you do not know why customers evaluate competitors, you cannot respond to the evaluation before it becomes a decision.
Churn Prediction: How to Spot At-Risk Customers Before They Leave
Churn prevention is most effective when it happens 60 to 90 days before the renewal decision, not after a cancellation notice. The signals that predict churn almost always precede the actual churn event by weeks or months.
Leading indicators to track
- Login frequency decline. Customers who reduce their product usage without a stated reason are often in evaluation mode with a competitor or experiencing product dissatisfaction. A 50% week-over-week drop in active sessions is a meaningful signal.
- Support ticket velocity. Accounts with a sudden increase in support tickets, particularly around the same feature area, signal unresolved friction. An increase without a corresponding resolution also signals dissatisfaction rather than engagement.
- Feature adoption stall. Customers who have not activated a core feature after 60 days have not yet experienced the value that drives retention. They are at risk regardless of their payment status.
- NPS or CSAT score decline. A drop of 20 points or more on account-level NPS or consistent low CSAT scores across support interactions are among the strongest retention warning signals available. See how net promoter score trends at the account level predict renewal outcomes.
- Stakeholder change. When the product champion at a customer account leaves the company, the account loses its internal advocate. That transition is a high-risk moment that should trigger proactive CS outreach.
Customer health scoring
Most CS platforms combine usage, support, satisfaction, and contractual signals into a composite health score that categorizes accounts as green, yellow, or red. The value of the health score is not its precision: it is its ability to direct CS team attention toward the accounts where intervention is most needed and most likely to succeed. Companies using product usage data for churn prediction report retention rates 15% higher than those that do not. The score is not the intervention; it is the prioritization mechanism.
How to Reduce Customer Churn
Fix onboarding before fixing anything else
Early-stage churn (months 1 to 3) accounts for a disproportionate share of total churn in most SaaS businesses. The customers most likely to churn in year one are those who never experienced the product’s core value. Structured onboarding with milestone-triggered check-ins, in-app guidance, and usage-based alerts for customers who are not progressing converts passive sign-ups into activated users. Activated users do not churn at the same rate as passive ones.
Build a proactive customer success program
Proactive customer success outreach at key milestones increases customer lifetime value by 20%, compared to reactive CS that only engages after a problem is raised. The operational model: health score monitoring that triggers CS activity on yellow accounts 60 to 90 days before renewal, quarterly business reviews with economic buyers (not just end users), and structured expansion conversations that make the renewal a growth event rather than a binary stay-or-go decision.
See how customer success metrics translate into account health signals that CS teams can act on before the renewal decision is made.
Reduce support friction at every touchpoint
Every interaction where a customer has to repeat themselves, re-explain their issue to a new agent, or wait through a transfer reduces their tolerance for the product’s shortcomings. Support quality is a churn variable. Kayako’s SingleView technology gives agents the full account context before the first message, eliminating the friction that compounds over a customer’s lifetime into cancellation.
See how omnichannel customer service reduces the context loss between channels that creates the most frustrating support experiences.
Fix involuntary churn with dunning automation
If 20 to 40% of your churn is involuntary, you can recover a significant portion of it through dunning automation: pre-expiry card update reminders sent 30 days before a card expires, automated payment retry sequences that stagger attempts across different times and days, in-app prompts for accounts in payment failure, and a customer-friendly reactivation flow for accounts that have already lapsed. Recurly data shows that optimized dunning recovers between 10 and 26% of failed payments that would otherwise convert to involuntary churn.
Offer pause and skip options before cancellation
Customers who initiate a cancellation are often responding to a temporary circumstance: a budget freeze, a team restructuring, a seasonal slowdown. Subscription businesses that offer a pause or skip option at the cancellation point retain customers at 20 to 30% higher rates than those that force a full cancellation (RetentionCheck). The mechanism is simple: pause converts an irreversible decision into a reversible one.
Negative Churn: When Expansion Outpaces Customer Losses
Negative churn is the most powerful state a subscription business can achieve. It occurs when the revenue generated from expansion within the existing customer base with upsells, seat additions, cross-sells, and price increases exceeds the revenue lost to churn and contraction in the same period. The result is a Net Revenue Retention rate above 100%: the existing customer base grows in revenue terms without any new customer acquisition.
Negative churn is not reserved for elite companies. Any business where customers have room to expand their relationship with more products, more users, more usage, and higher tiers can engineer negative net revenue churn through a deliberate expansion motion. The structural prerequisites are: a pricing model that grows with customer usage or scale, a CS motion that identifies and acts on expansion signals before competitors do, and a product roadmap that gives existing customers new reasons to spend more.
What negative churn looks like in practice
Starting MRR from existing customers: $500,000
Gross MRR lost to churn and contraction: -$25,000 (5% gross revenue churn)
Expansion MRR from existing customers: +$40,000
Net MRR change from existing base: +$15,000
Net Revenue Retention = ($500K + $40K – $25K) / $500K x 100 = 103%
Negative revenue churn: the existing base grew 3% despite losing 5% to churn.
Common Mistakes When Measuring Churn
- Monthly vs. annual confusion. A 3% monthly churn rate is not equivalent to a 36% annual rate. It compounds to 30.6% annually. Always convert correctly, and always specify whether a reported churn figure is monthly or annual.
- Mixing customer churn and revenue churn. A company can have 10% logo churn and 5% revenue churn (because the churned customers were small) or 5% logo churn and 15% revenue churn (because the churned customers were large). The two metrics answer different questions and require different interventions.
- Including new customers in the churn denominator. New customers acquired during a period should not appear in the starting count used to calculate that period’s churn rate. Including them artificially lowers measured churn and makes the business look healthier than it is.
- Ignoring involuntary churn. Companies that measure only active cancellations miss the 20 to 40% of total churn driven by payment failures. This is the most recoverable churn, and it is invisible if you are not tracking it separately.
- Using aggregate churn to make segment-level decisions. A company-level churn rate of 8% that includes an SMB segment at 15% and an enterprise segment at 2% requires two completely different responses. Aggregate churn hides the specific problem and prevents the specific fix.
- Survivor bias in cohort analysis. Cohort retention charts that show current customers only (excluding those who have already churned) systematically overstate retention. Build full cohort tables that include all members of each cohort, including those who left in earlier periods.
Best Tools for Measuring and Reducing Churn
ChartMogul
Best for: SaaS subscription analytics. The most comprehensive cohort churn analysis, MRR movement breakdown, and NRR trending available for recurring-revenue businesses. Direct billing integrations eliminate manual data entry.
Baremetrics
Best for: Early-stage SaaS teams wanting fast deployment and clean dashboards. Real-time churn tracking, cohort views, and recovery flow for churned customers via Cancellation Insights, which captures why customers canceled in the exit flow.
ProfitWell Retain (Paddle)
Best for: Involuntary churn reduction. Retain is the most purpose-built dunning automation tool available, with intelligent payment retry logic, card-update prompts, and recovery flow optimization that recovers between 10 and 26% of failed payments.
Gainsight
Best for: Enterprise B2B CS teams. Connects usage data, support ticket history, and satisfaction scores into health score models that predict churn 60 to 90 days in advance and trigger automated CS playbooks for at-risk accounts.
Planhat
Best for: Mid-market CS teams wanting health scoring, renewal tracking, and expansion playbook management in a single platform. Cleaner interface than Gainsight at a lower price point; strong for teams between 50 and 500 customer accounts.
Maxio (formerly SaaSOptics)
Best for: SaaS companies needing revenue recognition compliance alongside churn analytics. Tracks gross and net revenue churn across complex billing structures that standard analytics tools cannot parse correctly.
Userpilot
Best for: SaaS product teams wanting in-app churn reduction: onboarding flows, feature announcement modals, and in-product NPS surveys that identify at-risk users before they stop logging in.
Recurly
Best for: Subscription businesses with complex billing models. Strong native dunning management, involuntary churn analytics, and retry logic configuration that works across multiple payment gateways and card networks.
Real-World Churn Reduction Case Studies
Netflix: personalization as a retention tool
Netflix’s recommendation engine is commonly discussed as a discovery tool. Its primary function is churn prevention. A viewer who consistently finds content to watch does not cancel. Netflix data scientists have estimated that the recommendation engine creates billions in annual value by keeping subscribers engaged across the content library rather than churning after a single show ends. The mechanism: reducing the effort required to find value after a completed viewing session is the equivalent of reducing customer effort in support, and both outcomes protect retention.
Spotify: pause and skip mechanics
Spotify’s premium cancellation flow includes a pause option for up to 3 months. For users who are canceling because of a temporary budget constraint — a job change, a student loan payment — the pause option converts an irreversible decision into a reversible one. Subscription businesses that offer a pause option retain customers at 20 to 30% higher rates at the cancellation point. Spotify applies this logic to millions of potential churners per year.
Amazon Prime: the commitment device
Amazon Prime’s annual subscription creates a strong commitment effect: having paid $139 upfront, members are motivated to use the service enough to justify the cost. Annual billing reduces apparent churn by 60 to 80% compared to equivalent monthly contracts (RetentionCheck), not because customers are more satisfied, but because the renewal decision happens once rather than twelve times. The structural insight: the billing cadence is itself a churn prevention mechanism.
The ecosystem for customers today is filled with options. It is easy for them to choose a different service if it offers them the best price, services, or just a better value for their buck. In such scenarios, it becomes incredibly important for an enterprise to ensure that it doesn’t let the inactivity slide. This requires proactive communication with the customers and anticipating what they might need from your services. Because at the end, everything leans into customer experience.
FAQs
What is customer churn rate?
Customer churn rate is the percentage of customers who cancel or do not renew their relationship with a business over a defined period. It is the inverse of retention: 90% retention equals 10% churn. Churn matters so much in subscription businesses because it eliminates not just current revenue but all future revenue, expansion potential, and referral value that churned customers would have generated.
What is the formula for customer churn rate?
Churn Rate = (Customers Lost in Period / Customers at Start of Period) x 100. New customers acquired during the period are excluded from both the numerator and denominator. Always specify whether the figure is monthly or annual, and convert correctly: monthly churn does not multiply by 12 because it compounds. The correct annual equivalent of 3% monthly churn is 30.6%, not 36%.
What is a good churn rate in 2026?
For B2B SaaS, the median annual churn rate is 3.5% (Recurly 2025). Below 5% annually is solid ground for established companies. Enterprise SaaS should target below 5%; mid-market 5 to 8%; SMB-focused products 8 to 15% is typical, given that approximately 20% of small businesses fail within their first year. Consumer subscriptions typically see 10 to 20% annual churn. Annual logo retention runs 80 to 85% at the seed stage and 95 to 98% at pre-IPO scale (RetentionCheck). Always benchmark against your specific segment, not the B2B median.
What is the difference between customer churn and revenue churn?
Customer (logo) churn measures the percentage of customers who left. Revenue churn measures the percentage of MRR lost. A company with 10% logo churn can have 5% revenue churn if the churned customers were small, or 15% revenue churn if they were large. Gross Revenue Retention (GRR) captures churn and contraction without expansion, setting the floor. Net Revenue Retention (NRR) includes expansion and can exceed 100% if expansion outpaces losses, producing negative net revenue churn. The two metrics require completely different interventions and should never be combined or substituted for each other.
What is involuntary churn?
Involuntary churn occurs when a customer’s subscription is terminated due to a failed payment — an expired credit card, insufficient funds, or a declined transaction — rather than an active cancellation decision. The customer did not choose to leave. Involuntary churn accounts for 20 to 40% of total churn in most subscription businesses and is recoverable through dunning automation: retry logic, card-update prompts, and customer-facing reactivation flows. It is the most recoverable form of churn because the customer’s intent to stay has not changed; only their payment method has failed.
How do I reduce customer churn?
The five highest-leverage interventions, in order of typical impact: (1) fix early-stage onboarding to ensure customers reach their first value milestone within 30 days; (2) implement proactive CS health scoring to identify at-risk accounts 60 to 90 days before renewal; (3) reduce support friction — poor support quality is a silent churn driver, and high customer effort scores at the interaction level predict non-renewal; (4) automate dunning to recover involuntary churn before it becomes permanent; (5) offer a pause option in the cancellation flow to convert irreversible cancellations into temporary pauses.