Which survey will measure customer loyalty and show us who our best customers are and those at risk of churn?
Customer surveys that measure advocacy, satisfaction, and effort don’t give us the insights we need.
Even though the Net Promoter Score (NPS) was designed to measure customer loyalty, it’s limited by capturing overall trends in customer loyalty not why that trend is happening.
By running an NPS survey in isolation you don’t get the low-down on which customers have service satisfaction or suffer high-effort experiences.
But customer satisfaction scores (CSAT) and customer effort scores (CES) offer few insights into customer loyalty either.
And Fred Reichheld, author of The Ultimate Question: Driving Good Profits and True Growth, found that satisfaction isn’t an indicator of loyalty. For businesses that exclusively use customer satisfaction scores, Reichheld found these businesses still have a churn rate of 60-80% — even if customers were satisfied or very satisfied in their last CSAT survey.
Think about if you used customer satisfaction score (CSAT) as an indicator for loyalty:
A customer can give an average satisfaction score of 90% on all five conversations they had with you – and that might give you a high CSAT – but it doesn’t tell you the customer reported the same problem affecting them five times in a row.
The same applies for CES. Customers can have low effort experiences contacting you, but if they have to consistently get in contact, that’s a problem the CES is not going to highlight.
In both circumstances, the customer is happy support fixed their problem, but they are unhappy with the product for having the problem.
Metrics analyzed in isolation can leave support leaders confused:
- Why are customers with a 90% satisfaction rating on their last five conversations leaving?
- Will faster reply times make a customers more loyal?
- Is our pricing causing early attrition or churn?
How do you measure customer loyalty with metrics?
With almost 30 customer support metrics available to track, it can be hard to decide which one really measures customer loyalty.
The trick is to combine and layer your NPS data with CSAT or CES to a get a complete picture of your customers. Measuring customer loyalty with one metric is like trying to catch a ball with one eye closed — you have no perspective.
To get the correct perspective, collect NPS, and CSAT or CES, in a way that gives you reliable data.
Collect data the right way:
While you’re collecting this data on your customers already. It’s important to make sure we’re following best practices in measuring Net Promoter Scores, customer satisfaction, and customer effort accurately:
- Customer surveys should never be anonymous. You’ll be cross-referencing your data later to get a clearer picture of loyal customers and those about to churn.
- Send surveys at natural pause points. For customer effort or satisfaction, an automated follow-up 24 hours after a conversation has been resolved over email, but immediately after for live chat conversations. (For NPS this is different.)
How to collect customer satisfaction (CSAT)
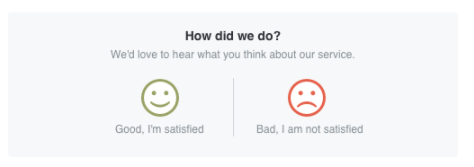
You measure customer satisfaction by sending a one question survey to your customers. These should be simple to answer. We recommend asking one clear-cut question after every transaction: “How did we do?”

With only two possible responses — one positive, one negative — means the customer will have less to think about. And the data you’ll receive back will be more polarizing so will help you spot and prioritize areas that need immediate improvement.
How to collect Net Promoter Score (NPS)
You measure NPS by sending your customers a short survey. In this survey, you ask your customers:
“How likely are you to recommend [Company A] on a scale of 1-10?”
Depending on their score, your customer will either be a Detractor, Neutral or a Promoter.

For most businesses, having your NPS survey on a loop collecting feedback every 180 days is recommended by Gainsight.
For SaaS companies, to get good data on brand advocates, automate your NPS survey to be sent to new customers 30 days after they become a customer (exclude free trial periods in this timeframe). If your company is shipping product updates regularly, find a cadence to track against the product release schedule so you get a good representation of before and after new updates.
How to collect customer effort score (CES)
Measure customer effort by asking your customers how easy they found their last interaction with you. Ask your customers:
“How easy was it for you to get your issue resolved fully?”
Customers respond on a 7 point scale from 1 (extremely difficult) to 7 (extremely easy).

Combine your NPS and CSAT scores
At this point, you want to decide whether you’re going to combine your NPS score with either your CSAT or CES results. We’re going to analyze NPS and CSAT in combination.
- Export your data from NPS surveys and recent satisfaction scores. Make sure each survey response corresponds with the correct customer by ordering them by customer or account names.
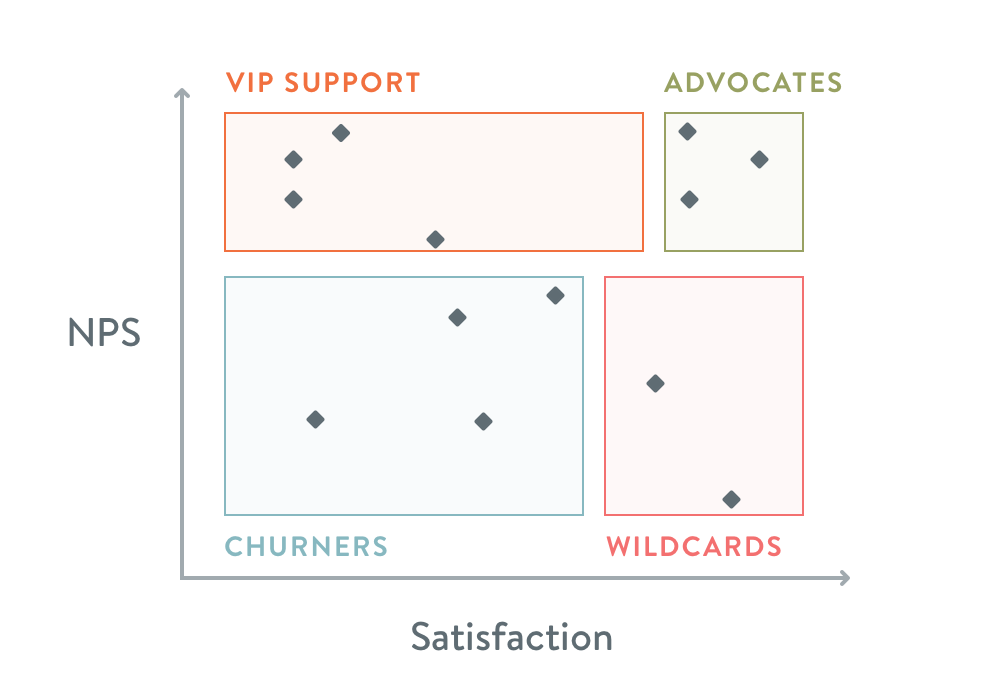
- Use a scatter graph to plot customer data for both NPS and satisfaction. You can do this in Google Sheets or Excel.
- You’ll be left with four types of customers based on these types of clusters. They will fit into these quadrants:

What kind of loyalty do these customers have?
VIP Support
These are promoters of your product, but they have suffered bad experiences with your support team.
Advocates
These are your most loyal customers. They have great experiences with your product and support team.
Churners
These customers are not satisfied or loyal to your business.
Wildcards
These customers are satisfied but disloyal. These customers sit with a lot of product frustration, and are considering moving on from your product.
How to act next
Naturally, you’ll want to jump on the Churners category and try to convince them to stay.
Unless your Churners category is more than 5% of your customer base, it’s unlikely to make much difference to the bottom line of your business. This will be time consuming, and in most cases, too late to rescue these customers.
The customers most likely to reward you with loyalty are your “wildcards” and “VIP support” groups.
Wildcards need product education
Wildcards sit with 80-100% satisfaction from the last few conversations they’ve had with your business, but they’re considering leaving.
These customers sit with a high level of product frustration. To keep them as customers, invest in education, product fixes, and proactive customer success calls to help them achieve their support objectives.
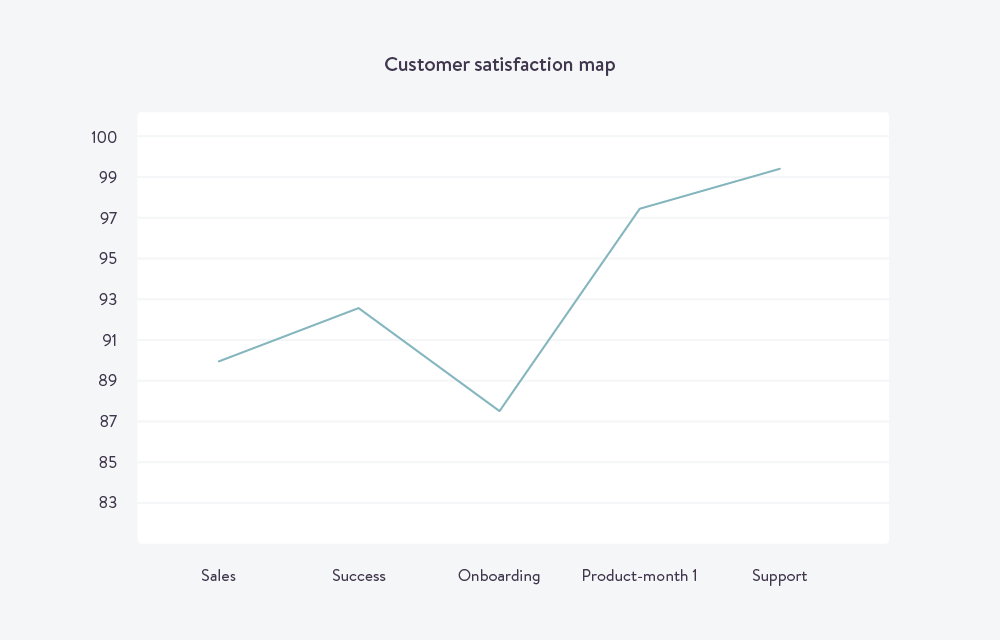
If you’re collecting customer satisfaction across the customer journey, you’ll be able to plot how satisfied customers are at different touch points with your business.
Plotting your CSAT across the customer support journey will give you better context and insight into where customers might be getting frustrated.

A graph like this will give you data driven approach into how you can optimize your product or service.
Focus on the VIP support category
Focus on the VIP Support category because these customers are the ones at most risk of churn!
This category has a high number of responses with low satisfaction scores, but a middle to high NPS responses. There is a very strong chance you can turn them into Advocates who help you drive new business.
Here are some tactics to help retain their loyalty:
- If they helped inspire a new upgrade to your service with their feedback – say thank you with a personalized thank you note or some merchandise
- Proactively reach out to them and offer them some personalized support and make sure you take care of their issue.
Proactively reaching out to help them to retain their loyalty becomes easier when you understand the context of their support history. After all, your customers are real individuals who come with their own unique journey.
To deliver a great customer support experience that retains loyal customers, you need the full customer context.
Simon from Brewfictus’s support team is able to do just that.
As Brewfictus integrate Kayako with Stripe and Shopify, Simon can see Taylor is a loyal customer of one year and her lifetime value is worth $450.25. With the use of journeys and conversations, Simon has Taylor’s entire customer history captured within a timeline in one place, he decides to upgrade her to priority shipping—a no brainer to create a delightful experience.
However, if you’re using a legacy support desk tool, and you’re struggling to see customers’ activities, now is a good time to introduce using all three of these customer surveys.
Start by giving CES its own quadrant.
Calculate the average CES over the lifetime of support conversations versus likelihood to repurchase (based on CSAT and NPS results). Their average customer effort score should show how close or far they are from being an Advocate.
The easier you make it for these customers, the more likely they are to repurchase.
Combine metrics to uncover loyal customers
There’s not one true metric to measure customer loyalty. And there are many metrics that can measure what kind of customer support you’re giving and how your customers feel about it. Through charting metrics together, you’ll have a clearer view of the state of your customer base.
Invest time in nurturing the right group of customers, and within a few weeks to months, you’ll have increased customer loyalty and moved them onto the becoming advocates of your business.