In 2003, Fred Reichheld published a Harvard Business Review article arguing that one question could predict business growth better than any customer satisfaction survey. That question was: “How likely are you to recommend us to a friend or colleague?” Two decades later, that single-question framework has become one of the most widely used metrics in business. Two-thirds of Fortune 1000 companies now track Net Promoter Score as a core performance indicator (IBM).
The enduring popularity of Net Promoter Score (NPS) comes from what it compresses: customer sentiment, loyalty likelihood, and referral behavior into a single number that can be trended over time, benchmarked against competitors, and acted on without a statistics team. This guide covers everything from the formula to the challenges, with benchmarks, collection methods, and the software that makes it operational.
What Is Net Promoter Score, and Why Does It Matter?
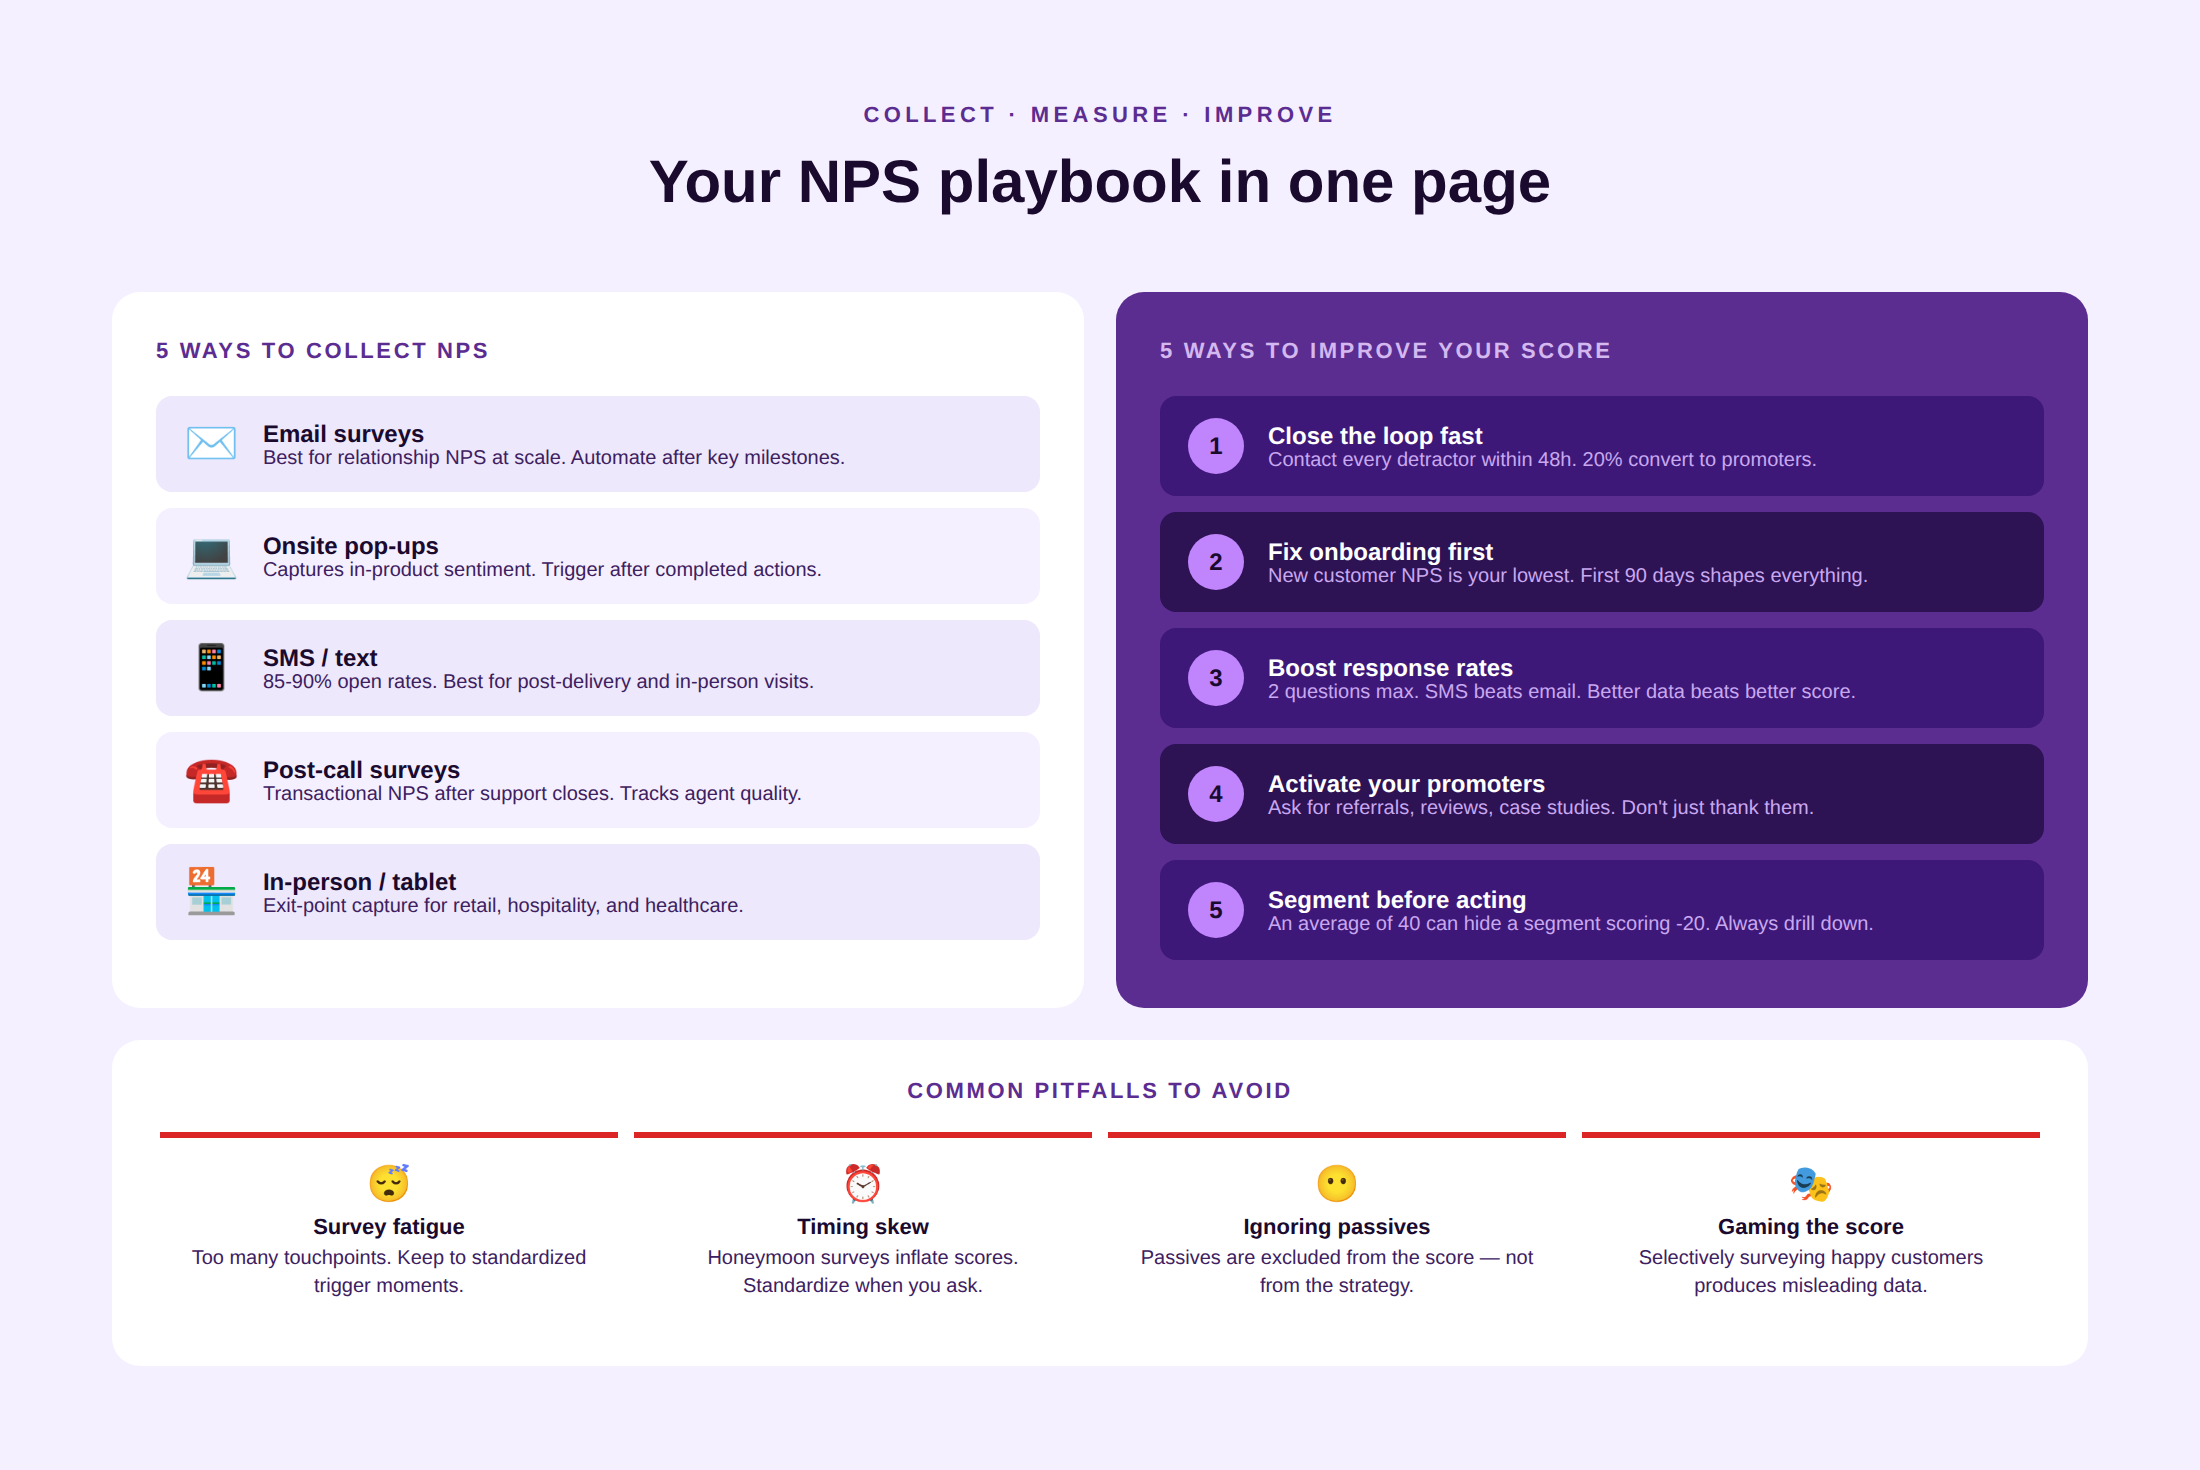
Net Promoter Score (NPS) is a customer loyalty metric that measures how likely customers are to recommend your business to others. It is calculated from a single survey question rated on a 0 to 10 scale, and the resulting score runs from negative 100 to positive 100. NPS was developed by Reichheld in partnership with Bain and Company, and the term “Net Promoter” is a registered trademark of Bain, Satmetrix, and Reichheld.
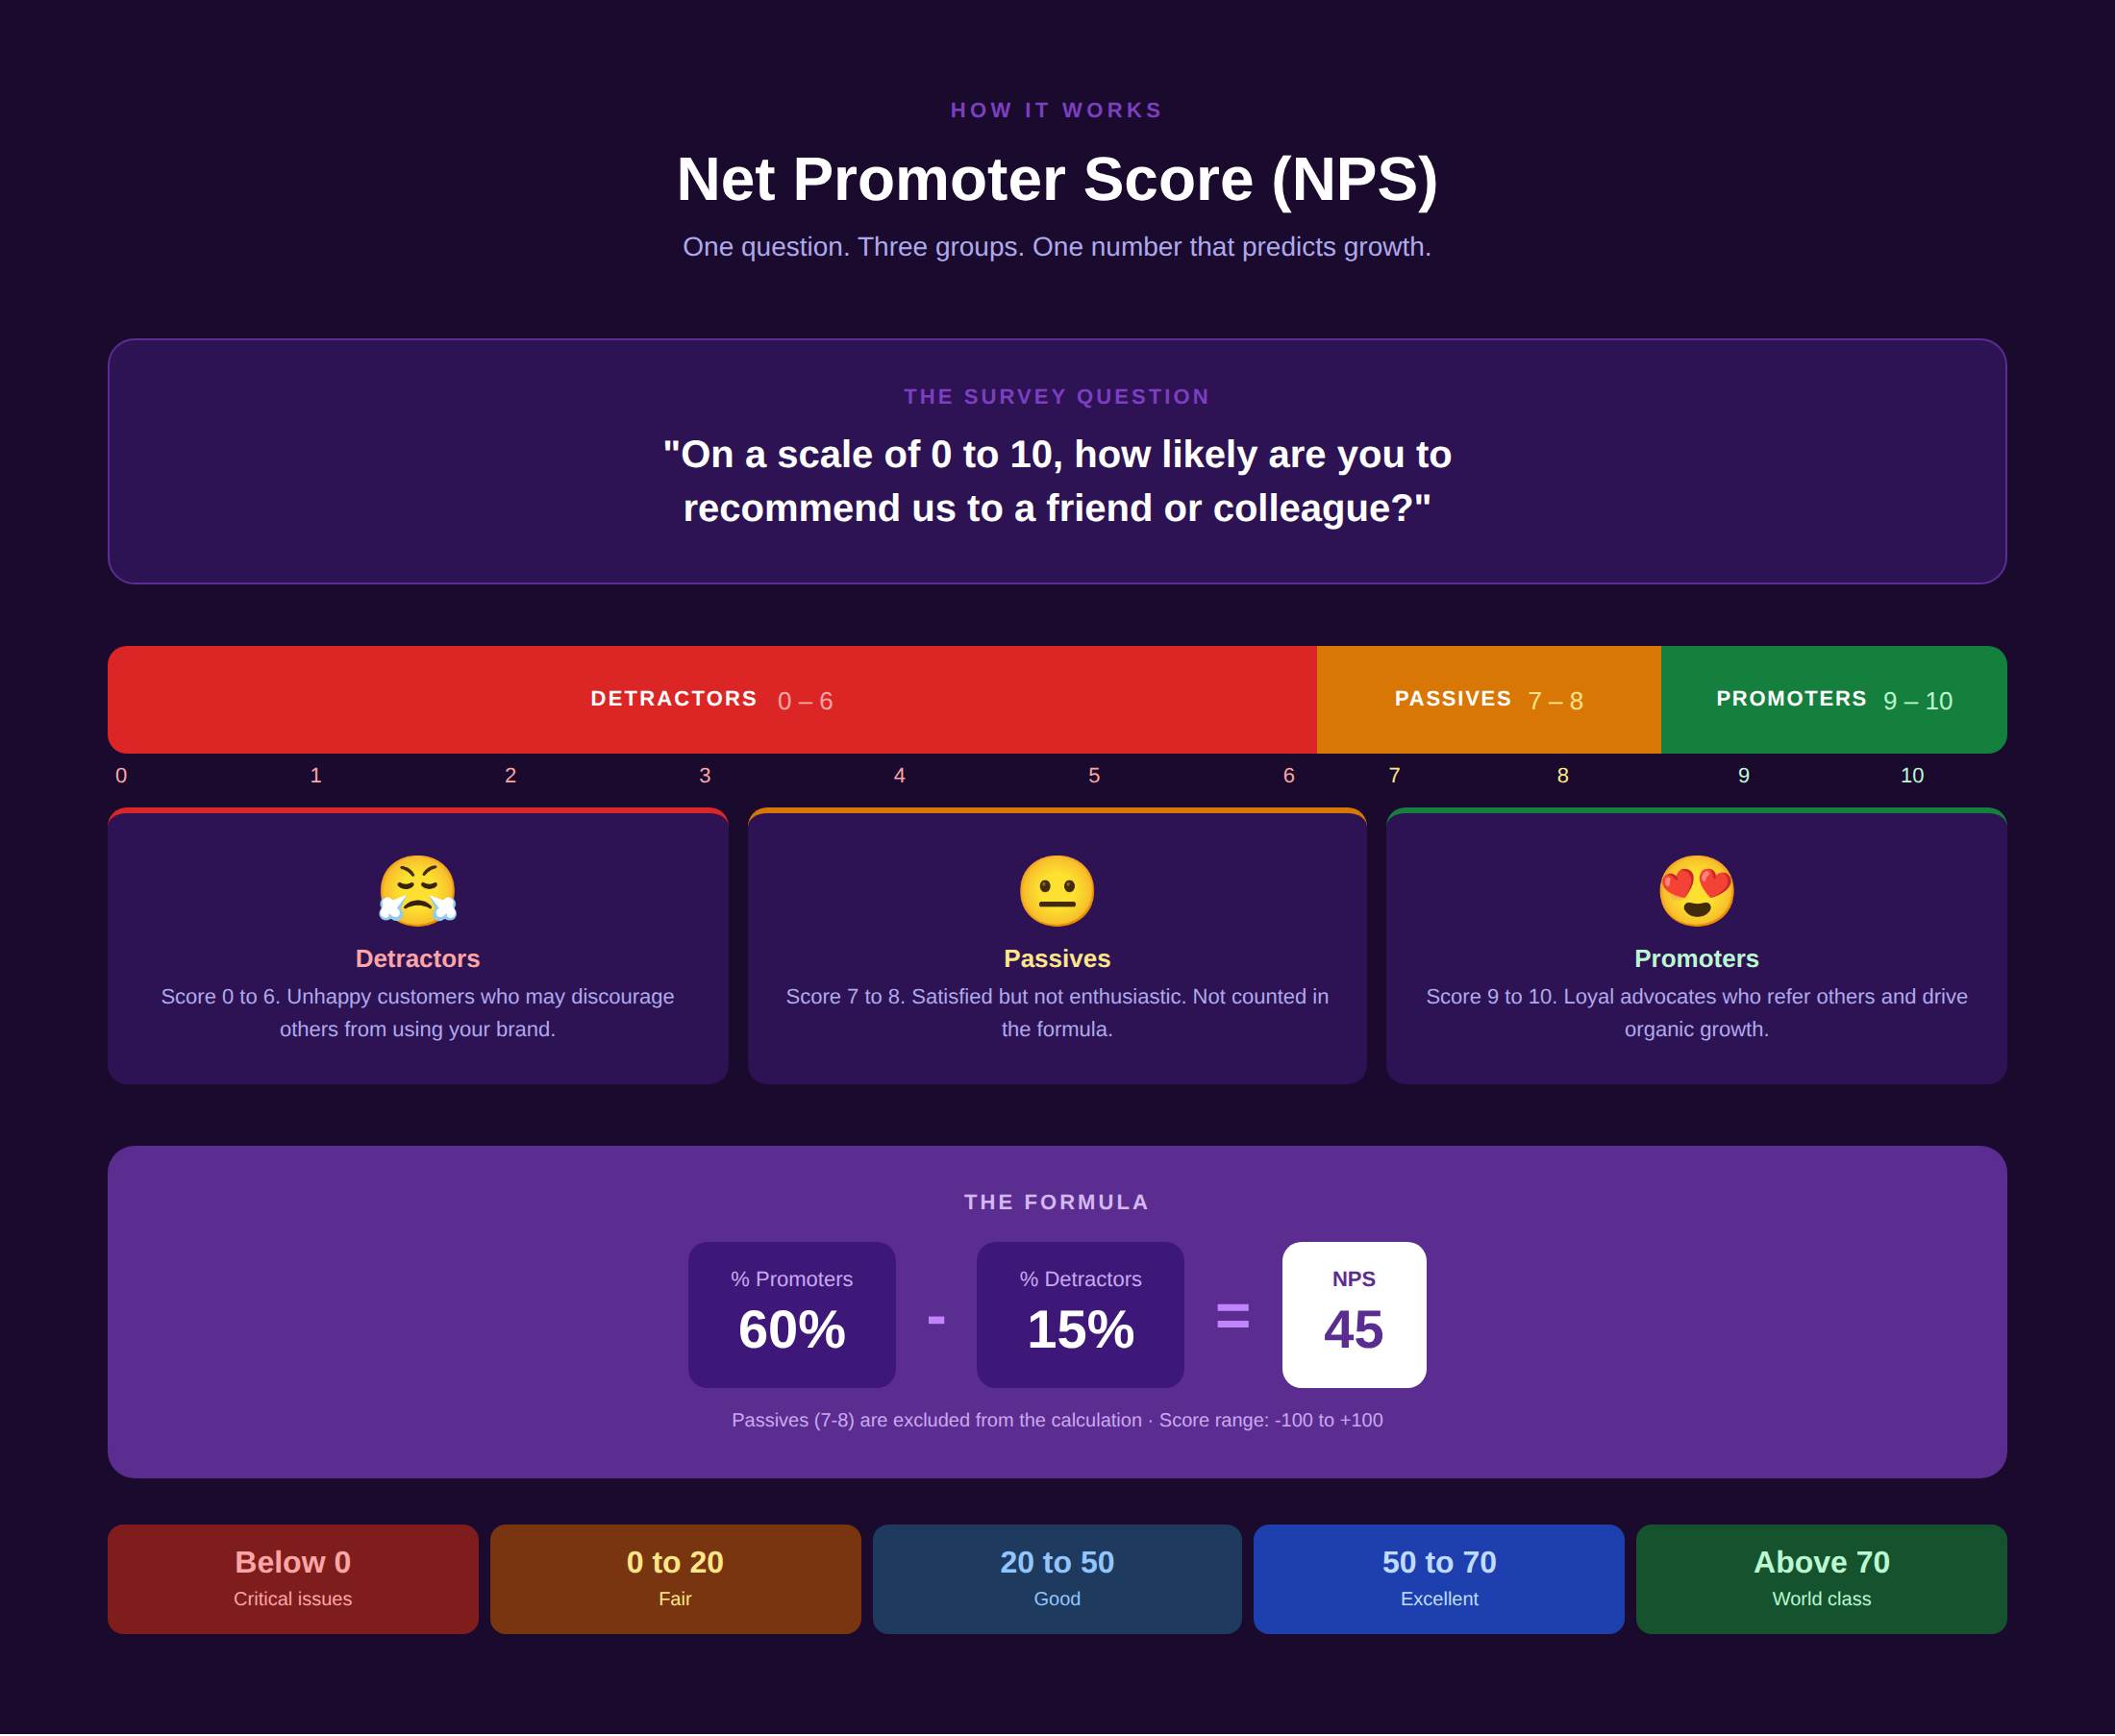
The metric matters for three reasons. First, it is predictive: companies in the top NPS quartile achieve 25% higher revenue growth than those in the bottom quartile (London School of Economics, cited in Medium, 2025). Second, it is actionable: the open-ended follow-up question reveals the specific why behind each score, turning a number into a roadmap. Third, it is simple enough to sustain: a two-question survey generates higher response rates than any multi-item questionnaire.
Beyond the customer version, many organizations also track Employee Net Promoter Score (eNPS), asking staff how likely they are to recommend the company as a place to work. Organizations with engaged employees outperform rivals with 21% higher profits and 17% better productivity (inFeedo, 2026). Employee and customer NPS tend to move together over time, making eNPS a useful early warning system for CX degradation.
How to Calculate NPS and What Is a Good Score?
The NPS formula
After collecting responses to the survey question, customers are sorted into three groups:
- Promoters (9 to 10): Loyal enthusiasts likely to refer your business and drive organic growth.
- Passives (7 to 8): Satisfied but unenthusiastic. Vulnerable to competitive offers. Not counted in the formula.
- Detractors (0 to 6): Unhappy customers who may damage your brand through negative word of mouth.
NPS = % Promoters minus % Detractors
Example: If 60% of respondents score 9 or 10 and 15% score 0 to 6, your NPS is 45. The range runs from negative 100 (every respondent is a detractor) to positive 100 (every respondent is a promoter).
Passives are deliberately excluded from the calculation. They represent neutral sentiment — not harmful, not helpful. Their absence from the formula keeps NPS focused on the gap between brand advocates and brand critics, which is the most commercially meaningful signal.
What is a good Net Promoter Score?
| Score range | What it means | Context |
| Below 0 | Negative — more detractors than promoters | Serious CX issues requiring immediate attention |
| 0 to 20 | Fair — room for significant improvement | Acceptable starting point; competitive pressure is high |
| 20 to 50 | Good — more happy customers than unhappy ones | Most solid businesses operate here |
| 50 to 70 | Excellent — strong loyalty and referral activity | Top performers in competitive categories |
| Above 70 | World class — exceptional loyalty | Apple, Amazon, and similar brands reach this range |
Industry context matters significantly. A score above 0 is good, above 20 is favorable, and above 60 is world-class (Merren CX, 2025) — but these thresholds shift by sector. Retail NPS benchmarks range from 30 to 70, while telecom typically clusters around 20 to 35 due to structural service reliability challenges. Always benchmark against your specific industry before drawing conclusions from the absolute number.
Use Kayako’s CSAT calculator alongside your NPS tracking to pair loyalty data with satisfaction data at the interaction level, giving you a more complete picture of where your customer experience stands.
How to Collect NPS Data
NPS data is only as useful as the collection method allows. Poorly timed, poorly distributed surveys produce data that reflects the survey experience as much as the customer experience.
Email surveys
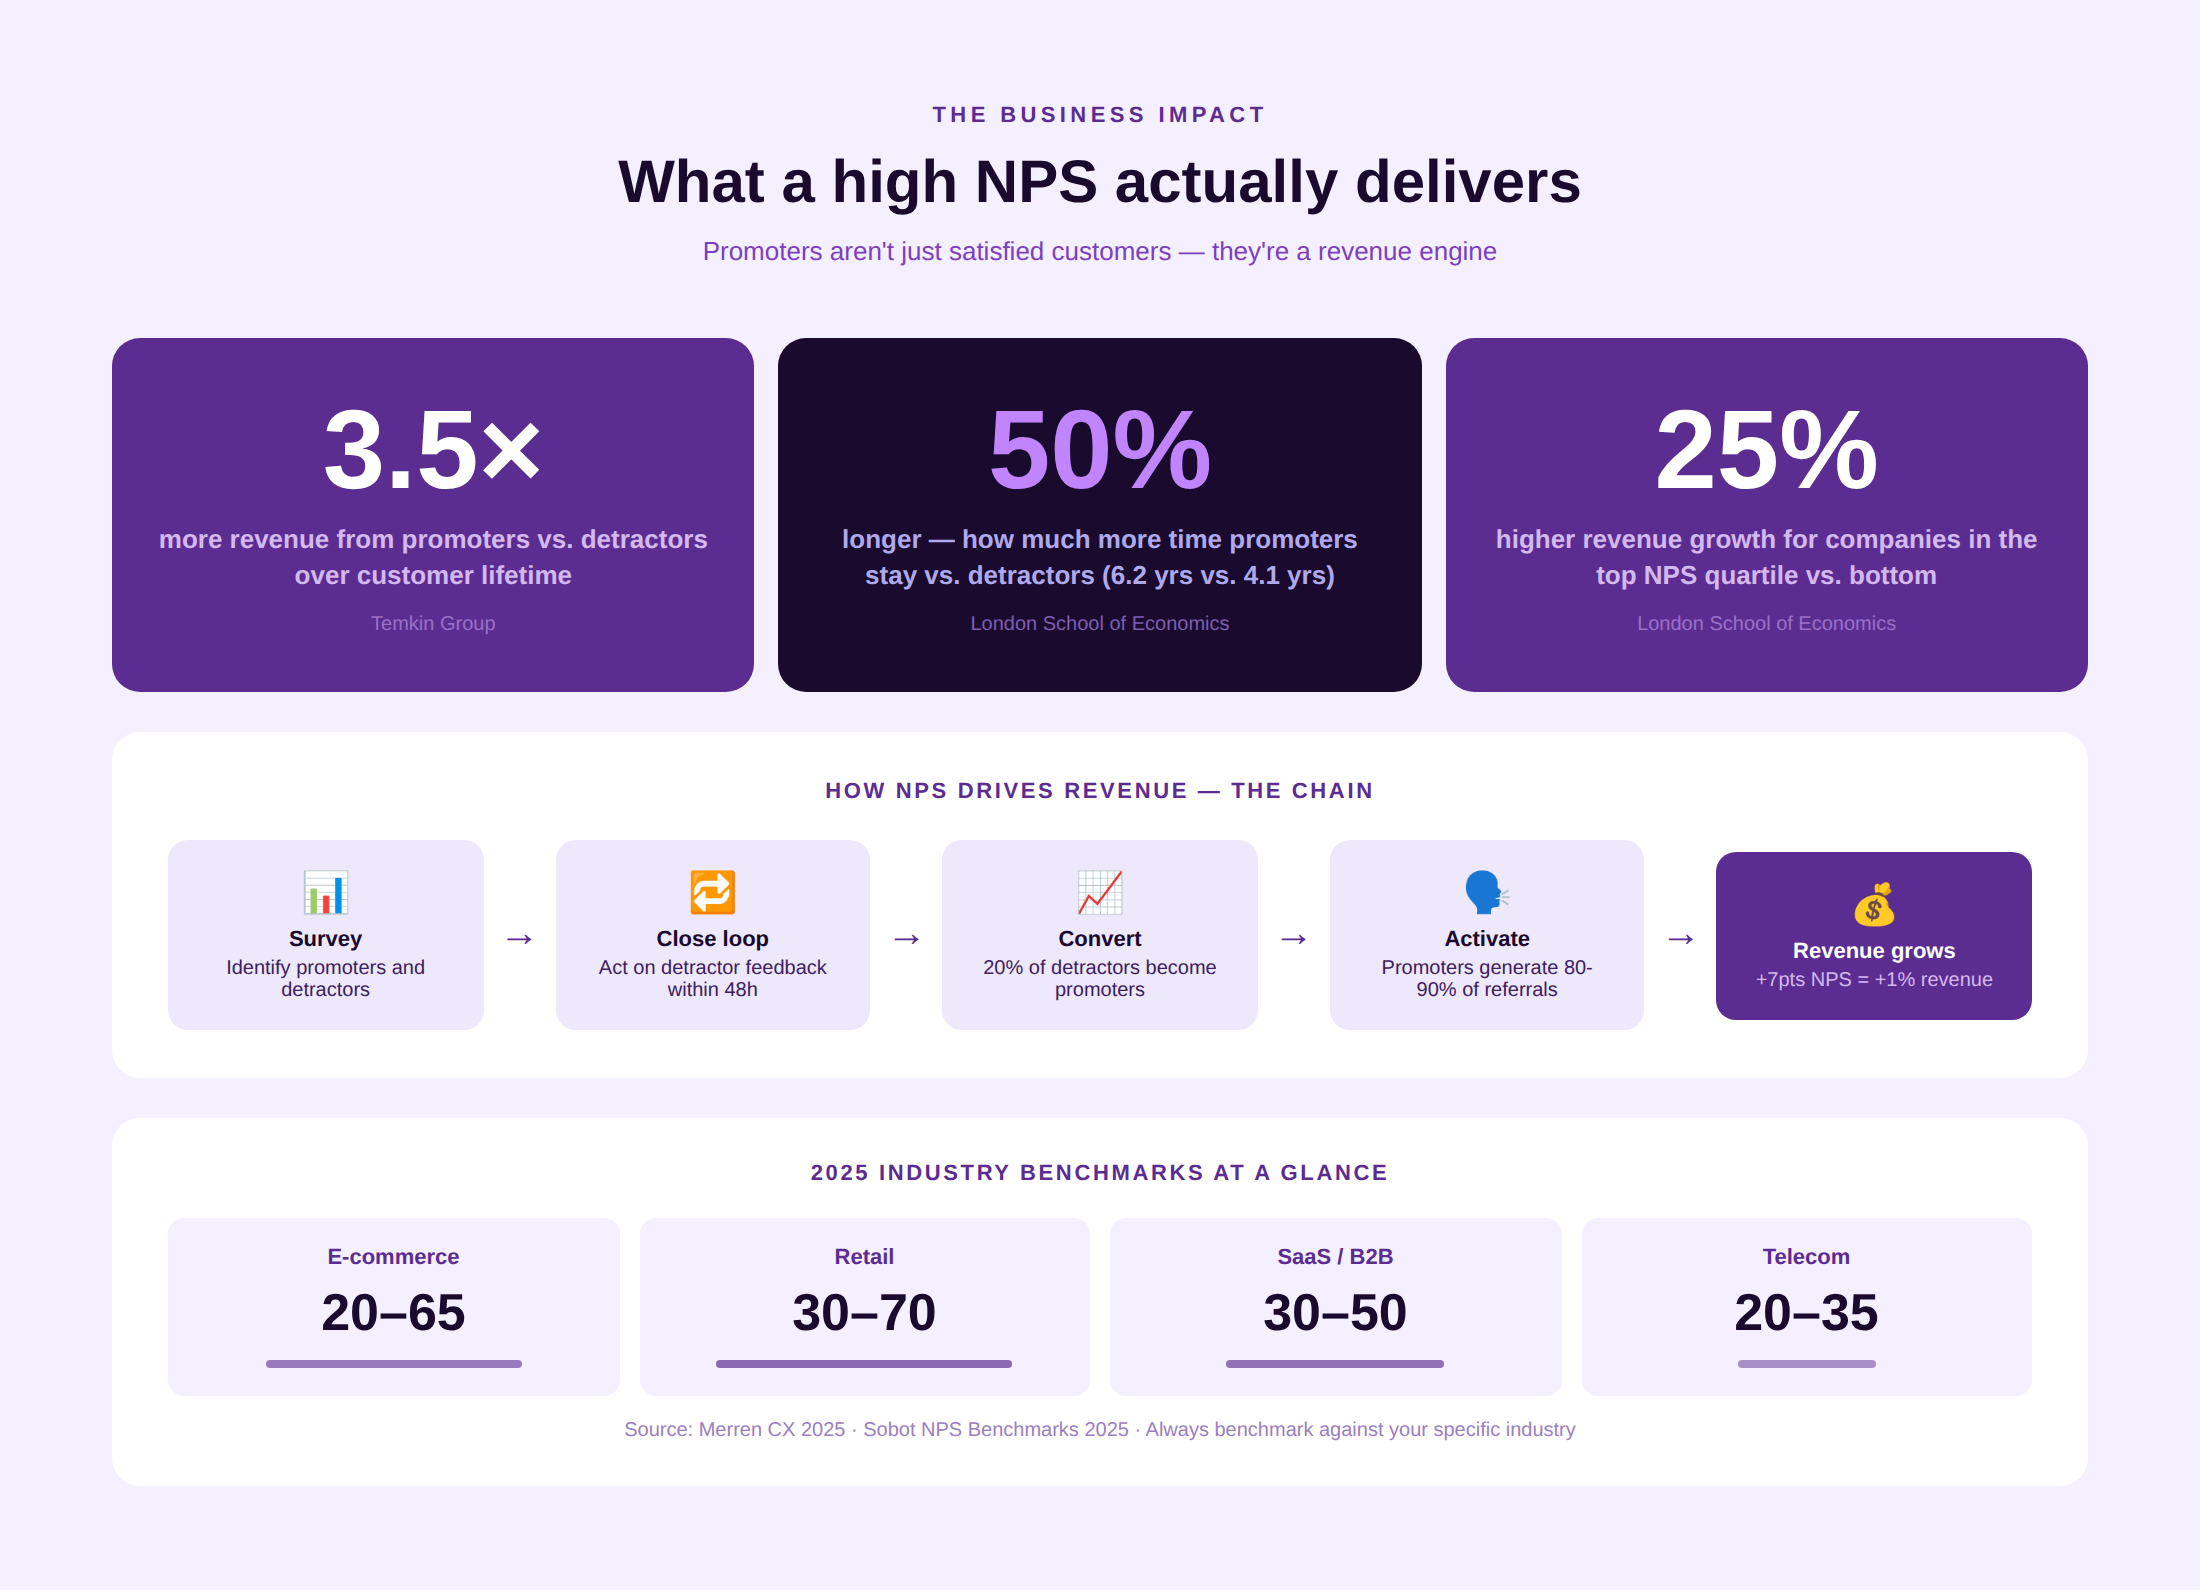
The most common collection method. An email containing the NPS question (plus an optional follow-up for context) is sent after a defined trigger point like a purchase, a support resolution, an onboarding milestone, or a scheduled relationship check-in. Email surveys produce reliable data at scale, are easy to automate, and allow follow-up on individual responses. The main risk is declining open rates as survey fatigue increases.
Onsite pop-ups
Embedded directly into your product or website, onsite NPS prompts capture in-the-moment sentiment without requiring the customer to leave. Best used at natural pause points in the user journey, such as when a key action is completed, after a first successful use, or when a usage milestone is reached. These capture responses from active users and typically generate higher response rates than email, but risk interrupting the experience if poorly timed.
Post-call and post-chat surveys
Triggered immediately after a support interaction closes — via IVR for phone, or an in-chat prompt for digital channels. These produce transactional NPS data: feedback tied to a specific interaction rather than the overall relationship. Transactional NPS is most useful for measuring support quality and identifying specific agents or issue types that drive detractors. See how live chat customer service integrates with post-interaction NPS collection for a closed-loop feedback model.
SMS and text surveys
SMS NPS surveys achieve open rates of 85 to 90%, significantly outperforming email. They work best for transactional moments where the customer is mobile — after a delivery, a service appointment, or an in-store visit. Length constraints make them most effective for the core NPS question and one optional follow-up, not extended surveys.
In-person surveys
Typically used in retail, hospitality, and healthcare settings where a face-to-face interaction has just concluded. Tablet-based prompts at exit points or in-room devices collect real-time responses. The main challenge is social desirability bias, that is, a customer may score higher when a staff member is nearby.
Relationship vs. transactional NPS
These collection methods map onto two survey philosophies. Relationship NPS surveys the entire customer base on a scheduled cadence (quarterly or annually) to track overall loyalty over time. Transactional NPS surveys customers immediately after specific interactions to measure the impact of individual touchpoints. Most mature NPS programs run both in parallel, using relationship NPS for strategic direction and transactional NPS for operational improvement.
Measuring NPS as a Success Metric
NPS becomes genuinely useful when it moves beyond a number on a dashboard and into decisions. Here is how different functions within a business extract value from it.
Customer success and retention
Detractors are the highest-priority signal in any NPS program. Research by Esteban Kolsky, a former Gartner analyst, found that only 1 in 26 unhappy customers actually complain, while the rest churn silently. An NPS detractor who completed the survey is a churner who gave you a warning. Customer success teams that close the loop with detractors within 24 hours can convert up to 20% of detractors into promoters (Surveyvista).
Product and engineering
The follow-up question (“What’s the main reason for your score?”) produces verbatim customer language about specific features, friction points, and missing capabilities. Systematically categorizing these responses reveals the product improvements most likely to move the needle on loyalty. Promoter feedback is equally valuable: it identifies the features and experiences your best customers attribute to their loyalty.
Sales and growth
Promoters are referral assets. 80 to 90% of positive referrals come from promoters (CustomerGauge). Building a structured promoter activation program, where the NPS follow-up for high scorers includes an invitation to write a review, participate in a case study, or provide a reference, converts loyalty data into a pipeline. In B2B specifically, a 10-fold increase in NPS score correlates with a 3.2% increase in upsell revenue.
Executive and board reporting
NPS provides a single, comparable metric that non-technical executives can track over time and benchmark against public competitors. Many companies publish NPS as part of investor communications, making it a proxy for customer health that analysts and investors treat as a forward indicator of revenue trajectory.
Kayako’s helpdesk platform connects NPS data to individual support tickets, closing the loop at the interaction level See How It Works
The Benefits of Net Promoter Score
- Simplicity. A single question, deployed in any channel, produces a score that any team member can understand and act on. NPS requires no statistical expertise to implement or interpret.
- Predictive power. Promoters generate 3.5x more revenue than detractors over their customer lifetime, and stay with companies 50% longer on average.
- Cross-functional alignment. A shared NPS metric creates a common language between customer success, product, marketing, and sales. All four functions influence the score; tracking it centrally creates joint accountability.
- Competitive benchmarking. Unlike internal satisfaction surveys, NPS uses a standardized methodology that allows direct comparison against industry peers, making it one of the few CX metrics with meaningful external benchmarks.
- Closed-loop capability. Triggered follow-up actions on detractor responses convert a measurement program into a retention program. The feedback loop is the product, not just the score.
- Early warning system. A declining NPS trend typically precedes a decline in revenue by several quarters, making it one of the best leading indicators of business health available at the CX level.
The Challenges of Net Promoter Score
Survey fatigue and low response rates
As NPS adoption has grown, so has customer exposure to NPS surveys. Response rates have declined industry-wide, and the customers most likely to respond are often the most engaged (skewing scores upward) or the most frustrated (skewing scores downward). Representative samples require active response rate management, not passive survey deployment.
The score lacks context by itself
An NPS of 42 tells you little without knowing what it was last quarter, what competitors are scoring, and what segment of customers generated it. The score needs the follow-up question data and the trend line to be actionable. Used as a standalone number, it often becomes a vanity metric that executives track without acting on.
Timing skews results
A post-purchase NPS survey sent during the honeymoon period after a new customer signs will consistently produce higher scores than a relationship survey sent at renewal time when the full product experience has been absorbed. Inconsistent timing produces incomparable data across cohorts. Standardize trigger points and timing before drawing trend conclusions.
Gaming and selection bias
Support teams and sales teams who know their NPS is being measured sometimes selectively request scores from customers they believe will score high, or deploy surveys immediately after a positive interaction rather than at standardized points. This produces artificially elevated scores that mislead internal planning.
Passives are underexplored
The NPS formula treats passives as invisible: they are excluded from the calculation and rarely receive follow-up. Yet passives represent the largest group in most distributions, and their trajectory, toward promoter or toward detractor, is often the most commercially significant signal in the dataset. Ignoring passives is one of the most common NPS implementation errors.
What Does a Negative Net Promoter Score Mean?
A negative NPS means more customers are detractors than promoters. A score of negative 10, for example, means 10% more of your respondents would actively discourage others from using your business than would actively recommend it.
The most common causes of a negative NPS are: poor product quality relative to expectations, slow or unhelpful support (particularly around issue resolution), a gap between what was sold and what was delivered, pricing that customers feel is unjustified by the experience received, and poor onboarding that prevents customers from realizing value quickly.
A negative score is not a death sentence, but it demands specific action:
- Contact every detractor within 48 hours. Reach out personally to understand what went wrong. Showing that the organization listens converts some detractors and always generates intelligence.
- Categorize detractor verbatim responses. Group the feedback by root cause. If 40% of detractors mention the same onboarding issue, that is a product priority, not a support ticket.
- Track score movement monthly, not quarterly. A negative NPS requires faster feedback loops than a healthy one. Weekly or monthly tracking with visible improvement targets keeps the team accountable.
- Pair NPS with Customer Effort Score to locate where friction concentrates in the customer journey. High effort at specific touchpoints is often the direct cause of detractor scores.
How to Improve Your Net Promoter Score
Close the feedback loop systematically
The most impactful NPS improvement lever is acting on individual feedback visibly and quickly. Customers who receive a meaningful response to their NPS follow-up are significantly more likely to convert from detractor to passive, or from passive to promoter. Automating the routing of low-score responses to account managers or support leads ensures that closing the loop happens at scale, not just for the accounts that teams have time to prioritize.
Address onboarding first
New customer NPS scores are typically the lowest in the relationship lifecycle. Poor onboarding prevents customers from reaching the product moments that generate loyalty, and the first 90 days disproportionately shape whether someone becomes a promoter or a detractor. A structured onboarding program, tracked with transactional NPS at each milestone, is one of the highest-ROI NPS improvement investments available.
Improve response rates before improving the score
A score based on a 5% response rate is not a representative signal. Before optimizing for the number, optimize for the sample. Keep surveys to two questions maximum. Send them at predictable, low-friction moments. Use the customer’s name and reference the specific interaction. Test SMS against email for your specific audience. A 20% response rate at an honest NPS of 35 is more valuable than a 5% rate at an inflated 55.
Activate promoters, not just detractors
Most NPS programs spend 90% of their follow-up effort on detractors and ignore promoters beyond thanking them. Promoter activation, asking high scorers for referrals, reviews, case study participation, or reference calls, converts a loyalty signal into a growth mechanism. The revenue impact of a structured promoter activation program typically outweighs any single point of NPS improvement.
Segment before you act
A company-wide NPS of 40 that includes a segment scoring negative 20 on a specific product line is not a healthy company-wide NPS. Segment your data by product, geography, customer tier, and acquisition channel before deciding what to fix. Aggregate NPS can mask the specific populations that need attention.
Best Software for NPS in 2025
These platforms cover collection, analysis, integration, and closed-loop follow-up.
1. Qualtrics
Best for: Enterprises needing advanced analytics, deep segmentation, and integration with HR and product data alongside customer NPS. Strong statistical analysis and driver analysis capabilities.
2. Medallia
Best for: Large-scale experience management programs connecting NPS to operational data in real time. Well-suited for financial services, retail, and hospitality enterprises.
3. Delighted (Qualtrics)
Best for: Fast deployment for mid-market teams. Clean survey interface, multi-channel distribution, and actionable dashboards. One of the easiest platforms to get live within a day.
4. SurveyMonkey (Momentive)
Best for: Teams already using SurveyMonkey for other research who want NPS integrated into an existing survey infrastructure. Strong panel access for external benchmarking.
5. Hotjar
Best for: Product and UX teams wanting NPS embedded alongside session recordings and heatmaps. Connects loyalty data directly to behavior data for richer insight.
6. AskNicely
Best for: Service businesses and field service operations running transactional NPS at high frequency. Strong Salesforce and CRM integration; built around the closed-loop follow-up model.
7. CustomerGauge
Best for: B2B companies wanting to monetize NPS by tying it directly to account revenue. The Account Experience framework connects NPS data to financial outcomes in ways most platforms cannot.
8. Zonka Feedback
Best for: Teams needing omnichannel survey distribution including SMS, email, tablets, and QR codes. Competitive pricing for the feature set; good for retail and hospitality contexts.
9. Typeform
Best for: Teams prioritizing survey design and response rates. Typeform’s conversational interface typically outperforms traditional survey formats on completion rates, which is meaningful when sample size is a constraint.
10. Kayako (with NPS integration)
Best for: Support teams wanting post-ticket NPS built directly into the helpdesk workflow. Kayako connects transactional NPS data to individual ticket records, so customer service teams can track how specific agent interactions, resolution speed, and first contact resolution rate affect loyalty scores over time.
Kayako closes the loop between support quality and NPS by connecting ticket data to customer satisfaction metrics See Kayako
Real-World NPS Examples and Case Studies
Taylor and Hart: doubling revenue through NPS focus
Taylor and Hart, a London-based custom jeweler, embedded NPS tracking at every stage of the customer journey, from initial consultation through delivery. By acting on detractor feedback to refine their design consultation process, they doubled revenue within two years. The score itself was not the driver; the operational changes triggered by each score were.
Philips Lighting: NPS as a revenue predictor
Philips Lighting correlated NPS fluctuations at the account level with annual revenue growth and decline. Accounts with an increased NPS experienced average revenue growth of 70%, while those with a declining NPS saw a 24% decrease in revenue (CustomerGauge, cited in Survicate). This data made the business case for NPS investment at the board level more effective than any customer satisfaction argument could.
Dell: converting detractors into revenue
Bain and Company found that Dell once had 15% of NPS detractors, accounting for $68 million of lost revenue. By converting just 2 to 8% of those detractors into promoters, Bain projected Dell could have grown revenue by $167 million per year. The case made the case: detractors are not just an experience problem; they are a revenue problem.
Wajax: promoter revenue vs. detractor revenue
Wajax, a Canadian industrial products provider, found that revenue generated from promoters was twice that of detractors. The finding reshaped how the company allocated account management resources, prioritizing detractor recovery at large accounts rather than pursuing new logo growth at equivalent cost.
There’s no better substitute for a business than word of mouth. NPS helps your company get the organic growth through smart data collection and insights that have a direct impact on your organization’s ascendancy. If you have a business and are on a constant verge to improve your customer experience, then a sound investment in NPS software makes perfect sense.
FAQs
What is the Net Promoter Score definition?
Net Promoter Score (NPS) is a customer loyalty metric that measures how likely customers are to recommend a business to others. It is calculated from a single survey question rated 0 to 10, where respondents scoring 9 or 10 are promoters, 7 or 8 are passives, and 0 to 6 are detractors. NPS equals the percentage of promoters minus the percentage of detractors, producing a score from negative 100 to positive 100. The metric was created by Fred Reichheld of Bain and Company in 2003.
How do you calculate Net Promoter Score?
Ask customers: “On a scale of 0 to 10, how likely are you to recommend us to a friend or colleague?” Categorize responses: 9 to 10 are promoters, 7 to 8 are passives (excluded from the calculation), and 0 to 6 are detractors. Calculate: NPS = (Number of Promoters divided by Total Respondents) x 100, minus (Number of Detractors divided by Total Respondents) x 100. The result is a whole number between negative 100 and positive 100.
What is a good Net Promoter Score?
Any score above 0 means more customers would recommend you than not. Above 20 is generally considered favorable. Above 50 is excellent, and above 70 is world-class. The right benchmark depends on your industry: telecom averages 20 to 35, while software and e-commerce can sustain 40 to 60. Always compare your score against your specific sector before concluding whether it is good or poor.
What is the difference between NPS and CSAT?
CSAT (Customer Satisfaction Score) measures satisfaction with a specific interaction or touchpoint, typically rated on a 1 to 5 scale immediately after an event. NPS measures overall brand loyalty and the likelihood to recommend, capturing sentiment about the relationship rather than any individual transaction. CSAT is a high-frequency operational metric; NPS is a lower-frequency strategic one. The two metrics complement each other and should be used together for a complete view of customer satisfaction across touchpoints and over time.